
How Game Theory Dooms the Challenger in Presidential Elections
Assuming the incumbent president runs for reelection, roughly every eight years there is an election in the United States that pits an incumbent president against the other party. In the upcoming 2020 election, that other party will be the Democrats, who are seeking to unseat President Donald Trump. Donald Trump is a historically unpopular president and the economy may be less–than–stellar come 2020, two factors that should indicate a competitive race. But there’s a problem – there could be around 15-20 candidates competing for the Democratic nomination to run against the incumbent president.For the sake of this exercise, we are ignoring Bill Weld’s Republican primary challenge against Donald Trump, which seems unlikely to turn into much. An incumbent president has not lost renomination since Chester A. Arthur lost to James G. Blaine in 1884, but incumbent presidents have faced significant primary challenges that may have lead to their downfall, which I’ll discuss later.
Those dozen-plus Democrats will have to raise a lot of money, hire staff, attack each other’s records, and prove to members of their own party why they each believe they are the strongest candidate. They’ll spend months doing this, perhaps even up until the Democratic National Convention in July of 2020 if no one wins a majority of delegates by then. This will ultimately leave the candidate who ends up winning the nomination drained of money and the target of attacks on their record, and then they’ll be forced to run another campaign again against an incumbent president who has spent all of this time building up a massive pile of cash and hiring staff, all without the added baggage of having to go through a competitive primary. This is not unique or inherently bad. The primary process ensures that the eventual nominee will be well trained to debate and campaign, as well as able to play to the issues they need to on a national stage (more on this later). But there is a well documented advantage to incumbency, and competitive primaries have been shown to negatively affect a party’s odds in the general election.
Candidates have to make adjustments when they become the presumptive nominee in order to triangulate and re-align with a certain voting base. They may even be forced to contradict what they said in the primary in order to appeal to the nation as a whole rather than just their party’s voters. There are countless examples of candidates being forced into this when facing off against an incumbent, whether it’s Democratic candidate John Kerry flip-flopping between the Democratic primary and general election in 2004, or Republican candidate Mitt Romney flip flopping in 2012. Even though 2016 was an open race without an incumbent, Hillary Clinton flip-flopped on free trade as she was dragged to the left in the primary, but was forced to reconcile these contradictions in the general, which contributed to the popular perception that she was dishonest. That’s because there are two competitions, and candidates must play to the “median voter” in both. This concept is called “median voter theory” and it’s an almost comically oversimplified theory of politics, but a nonetheless useful one for analytical and theoretical purposes.
Median voter theory rests on two main assumptions: that a political spectrum is one-dimensional (there’s the left on one end, and the right on the other), and that voters’ preferences are “single-peaked”, meaning that there is one ideology that provides more utility than others, and the utility degrades from there as you move farther from that ideology.For example, a Republican voter gets the most utility out of the most conservative candidate, slightly less utility from a moderate candidate, and the least utility from a liberal candidate. If voters’ preferences were multi-peaked, a voter would get the most utility from the far left and the far right, but the least from a moderate candidate. An example of how a multi-peaked voter might play out in reality would be a situation like that of a transgender voter who works in the coal industry: they probably get the most utility from a solidly Democratic candidate, or a solidly Republican candidate, whereas a moderate candidate would probably not take a bold stance in favor of either transgender rights or coal workers. In order to appeal to the median voter, it is in candidate’s interest to move to the median of where all voters are (to be as close as possible to the other candidate in a two-party system). This is reconciled with economics via “Hotelling’s Law”, of which the most common example is the distribution of two gas stations along a road and the solution of which explains why competing gas stations are usually catty corner to each other in the center of a stretch of road. It is the only location in which they can both maximize sales (they’ve reached the Nash Equilibrium, the only point where neither station could improve its position. Here’s a video explaining how this works if you’re interested in how the Nash Equilibrium plays out in reality). The Nash Equilibrium reconciled with median voter theory should put two candidates in a position with 50% of voters on either side of them (ostensibly incredibly moderate and near-identical in position in an election). Otherwise, one of them could simply move more to the left or the right and sweep up all of those voters as well.
But that’s the general election; what happens in the primary? How can we rationalize and reconcile median voter theorem in a multi-candidate field to find the Nash Equilibrium? Let’s think of the current Democratic primary as a game. No, not in the board or card sense, but in the economic sense: studying strategic interactions between multiple participants. It’s just like the gas stations: the game was to maximize sales, and the only way they could do that was be in the geographic median. To base our game on some data, know that as of 2018, 51% of Democrats identified as “liberal”, 34% as “moderate”, and 13% as “conservative” (the data is slightly more lopsided for Republican voters: 73% as “conservative”, 22% as “moderate”, and “4% as “liberal”). You’ll note that neither of these add up to 100%, due to rounding and so forth, so considering the trendlines and that this data was from 2018, I just applied the missing 2% to “liberal” for Democrats and the missing 1% to “conservative” for Republicans. That leaves us with this set of data for the party’s primary demographics:
| Identifier | Democrats | Republicans |
| “Liberal” | 53% | 4% |
| “Moderate” | 34% | 22% |
| “Conservative” | 13% | 74% |
Let’s start with a game where two generic ceteris paribus candidates (referred to as D1 and D2) are vying for the Democratic nomination. They’ll each want to capture at least one vote more than exactly 50% of the votes to win the nomination. Of course, the election is a zero-sum game (there can only be one winner) and because our candidates are identical in everything but name, this is a symmetrical game. To create the payoff matrix for this game, any time the candidates were “splitting” the voters (for example, if one was conservative and the other was liberal), I then divided the voters in the moderate category between the two; you can see the results of this in the third box on the first row below, where D1 oriented to the liberal vote and D2 oriented to the conservative vote, so I gave them each half of the 34% of the moderate vote. Of course, since there are only two candidates here, any time they were aligned, they each (all things being equal) would win half the votes.
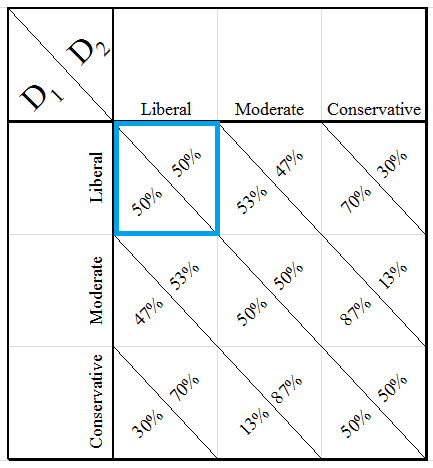
Payoff Matrix for a Two Candidate Democratic Primary
We can very quickly identify only one Nash Equilibrium (highlighted), which should seem fairly obvious – the way both candidates can max out their odds without allowing the other to triangulate and cut them off is to both run to the left, because otherwise the other can move to the left and get more voters right off the bat. Again, this is a bit of an oversimplification, but it lets us reconcile the median voter theorem of political science with economic game theory, and it lets us immediately see the problem: each candidate actually has to play two games with different payoffs in each ideology: the primary, and the general.
According to the same Gallup data referenced above, the national electorate identifies as follows: 35% “conservative”, 35% “moderate”, and 26% “liberal.” This leaves 4% unaccounted for, so I’m going to round off 1% to each “liberal” and “conservative” (as the American electorate has become more polarized in recent years), and give the last 2% to “moderate” (to compensate a bit for earlier, where we gave the benefit of rounding to “conservative” for Republicans and “liberal” to Democrats), and because if we truly don’t know, these votes will be split between more than one candidate vying for them anyway. So, we have our national electorate:
| Identifier | Electorate |
| “Liberal” | 27% |
| “Moderate” | 37% |
| “Conservative” | 36% |
And our national game, this time with D as the Democratic candidate and R as the Republican candidate:
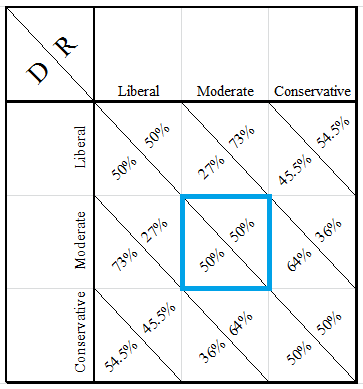
Payoff Matrix for a Two Candidate National Election
The results here should not be shocking either. They corroborate the median voter theory – as the Nash Equilibrium is now with both candidates taking more moderate positions and courting the center. It also lends credence to our points earlier about the problem: the non-incumbent nominee, who was drawn to the left in the primary, has to move closer to the center in the general election in order to compensate for the general electorate’s more moderate ideology. This dilemma is exacerbated when you consider how much the electorate has changed over time. The Gallup data we’ve been using for this game shows that Republicans have become more conservative and Democrats have become more liberal, and as each party moves away from the center, it becomes harder to break away and self-sorts parties ideologically over time (this is not a moral objection, just a mathematical one, and that’s probably perfectly fine to you and that’s okay; but if you’re interested in self-sorting and why it’s happened, check out Bill Bishop’s The Big Sort) – and leaves the challenging party more likely to lose.
So this seems bad for the challenging party, but how does this scale as more and more candidates enter the race? Does the Nash Equilibrium (or do the Nash Equilibria, rather, as the number of possible equilibria increase as the game enters more dimensions) move further to the center as the number of players increase?
This gets exponentially more difficult to chart and analyze as more players are added, with the total number of possible combinations expanding to 3n, where n is the number of players. And though this is a symmetric game, where all players share the same utility function and the differentiator is the strategy they choose opposed to the strategies the other identical players choose – this only provides some alleviation of the increasingly sophisticated mathematics. For every n player, we must use n dimensions to map the game.
I ran simulations on a Democratic primary with three and four candidates as well, and found similar data, which started to point in a more mathematically beneficial situation. With three candidates, three equilibria popped up, each with two candidates on the liberal (L), and one on the middle (M). And with four candidates, there were six equilibria, each with 2L and 2M. I extrapolated roughly on the five and six candidate games as well, estimating roughly 10 equilibria with a 3L and 2M breakdown in a five player game, and roughly 16 equilibria with a 3L to 3M breakdown in a six player game. This points to the natural state tending towards where all candidates are as close as possible in outcomes in a given game. So, for example, in an eight player game the equilibria is almost certainly 4L, 3M, and 1C; since this produces a breakdown of {13.25, 13.25, 13.25, 13.25, 11.33, 11.33, 11.3, 13}, no player here can make themselves better off by moving to another ideology. In other words, the Nash Equilibria are generally located at the points where the distribution of players is roughly representative of the party overall, or, put mathematically:
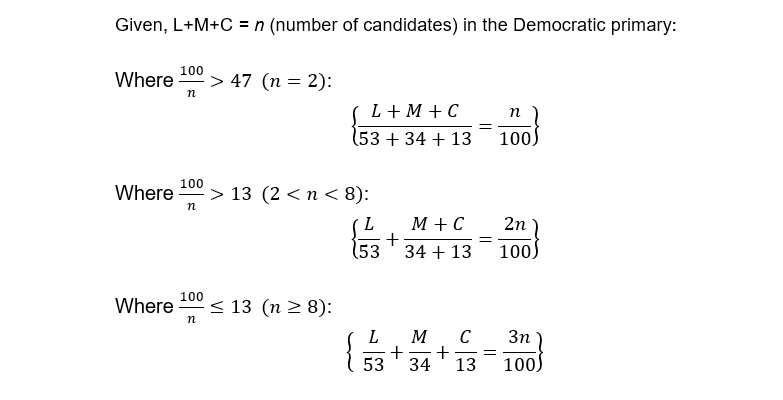
Why are there only three formulas for this and not one for every combination of L, M, and C? Because there are only three possibilities that allow for Nash Equilibria: all players as L; no players as C; or at least one of all L, M, and C. The logic for this was established earlier. Look back to the two player Democratic primary: as long as 100 (total percentage available) can be divided and the result is more than 47 (which is M+C, what they’d receive if they moved to M), no player will be incentivized to move to M or C since they can stay at L and split the pot with the other players. And, as long as 100 can be divided and the result is more than 13 (which is what a player would receive if they moved to C), no player is incentivized to move to C. So, for example, the formula for a situation where all players are at points M and C is unnecessary since a player would logically move to L and receive a higher share of votes immediately.
This also points to the values of possible Nash Equilibria as the number of candidates increases. Via the same calculation, as our value of n increases, our Nash Equilibria will be the points that allow candidates to all be as close as possible to
. In a game of 100 players, this will draw towards a division of 53L, 34M, and 13C – with each candidate drawing 1%. And finally, this gives us some mathematics to factor into our core problem: the situations where the plurality of votes go to a moderate candidate are infrequent and improbable as we scale in the number of candidates. Because
in order for a candidate in the moderate lane to receive a plurality, for every n+1 game, we approach finer and finer odds that M+1 will ever beat out L+1.For example, assume n is 100 players. In this game there would be 53L, 34M, and 13C. If we add an additional n+1 to 101 players, the way to maximize your vote percentage would be to choose L, since 53/54 = 0.98, while the player choosing M would result in 34/35, which is 0.97, and choosing C would result in 13/14, which is 0.92. Because the denominator is always the number of players at that point +1, the possibility for variation (because you cannot have a non-integer as a value of L, M, or C) and therefore deviation to give the non-liberal viewpoint the advantage is within the lowest n values. Therefore, the probabilities of the individual values for all candidates at L being lower than the individual values for all candidates at M decrease as n increases. It’s fairly easy to find a situation where this is not the case with a fairly low n value and n is an odd number (allowing a split of the largest share of votes in L). Consider n = 3 (where L is split between two candidates, each receiving 26.5%, while M receives the entire 47%) or n = 5 (where L is split between three candidates, each receiving 17.67%, while M is split between two candidates, each receiving 23.5%). A similar situation occurs at n = 7, and when we hit n = 9, the plurality actually appears to go to C, and this falls back in line with the trend around n = 15. Of course, this is a good time to remind you that splitting voters into L, M, and C is responsible for a lot of this deviation and fiddling around the decimal points. If we split voters into five groups (liberal, liberal-moderate, moderate, moderate-conservative, conservative) or just two (liberal or moderate) this would likely change to some degree, but the underlying
tendency and the fact that the party’s liberal wing is larger than its others is best illustrated with these examples.
Now that we have this foundation, let’s go back to the original problem: that the candidate challenging an incumbent president must face two elections, and that they must use divergent strategies to win both of them. In an ideal situation, they would play the strategy that maximizes their chances in both the primary and the general, and there’s a way to show this by combining both models. In the model below, there are two Democratic primary candidates, each needing to get the highest vote in the primary and then in the general (represented with the number below, which assumes the Republican has aimed to maximize their vote by remaining in the moderate lane):
Payoff Matrix for a Two Candidate Democratic Primary with General Election Percentage Below
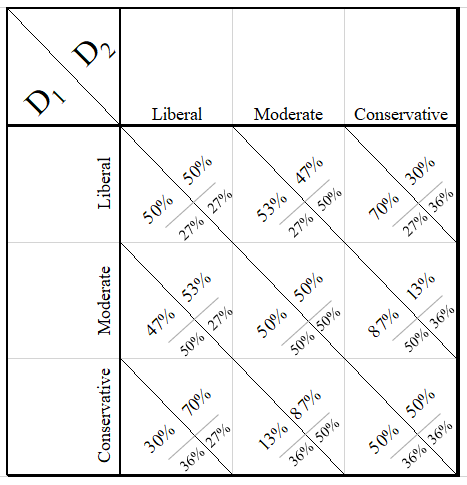
Suddenly a more complicated picture emerges: in theory the only way for both candidates to maximize their odds in the general election is to play the moderate strategy. But this undercuts their odds in the primary, since if we assume D1 takes the moderate strategy D2 can play the liberal strategy and win the primary, even though this diminishes the party’s overall chances at then winning in the general. This actually illustrates the documented problem fairly well. My attempts to muddy it up with game theory and math aside, we’ve got an apt depiction of the contradictory incentives in a presidential election when one party has to face a primary and the other does not. Much like in the famous prisoner’s dilemma, both rationally-acting players in this game are lead to the least-desirable outcome simply by the incentive structure. If we similarly increase the primary to n = 3, so there are three candidates, we have a good comparison point on these contradictory incentives. Look at the payoff matrix for the three candidate game (to show that the matrix also expands in an additional dimension, I’ve stacked them side-by-side, so D3 takes the liberal position in all games in the first 3×3, moderate in the second, and conservative in the third). In each box corresponding to the chosen policies of the player, D1’s vote percentage is listed first, D2’s is second, and D3’s is third. The national election result of sticking to that strategy is listed underneath, and because the national election results would go to the winner of the primary race, only that number is shown.So, for example, in the situation where D1 plays the moderate strategy, D2 plays the liberal strategy, and D3 plays the conservative strategy – the breakdown (in the third matrix) is D1 at 34% of the vote, D2 with 53%, and D3 with 13%. In this case, the player playing the liberal strategy would win the primary, and therefore they’d automatically only get 27% in the national election.
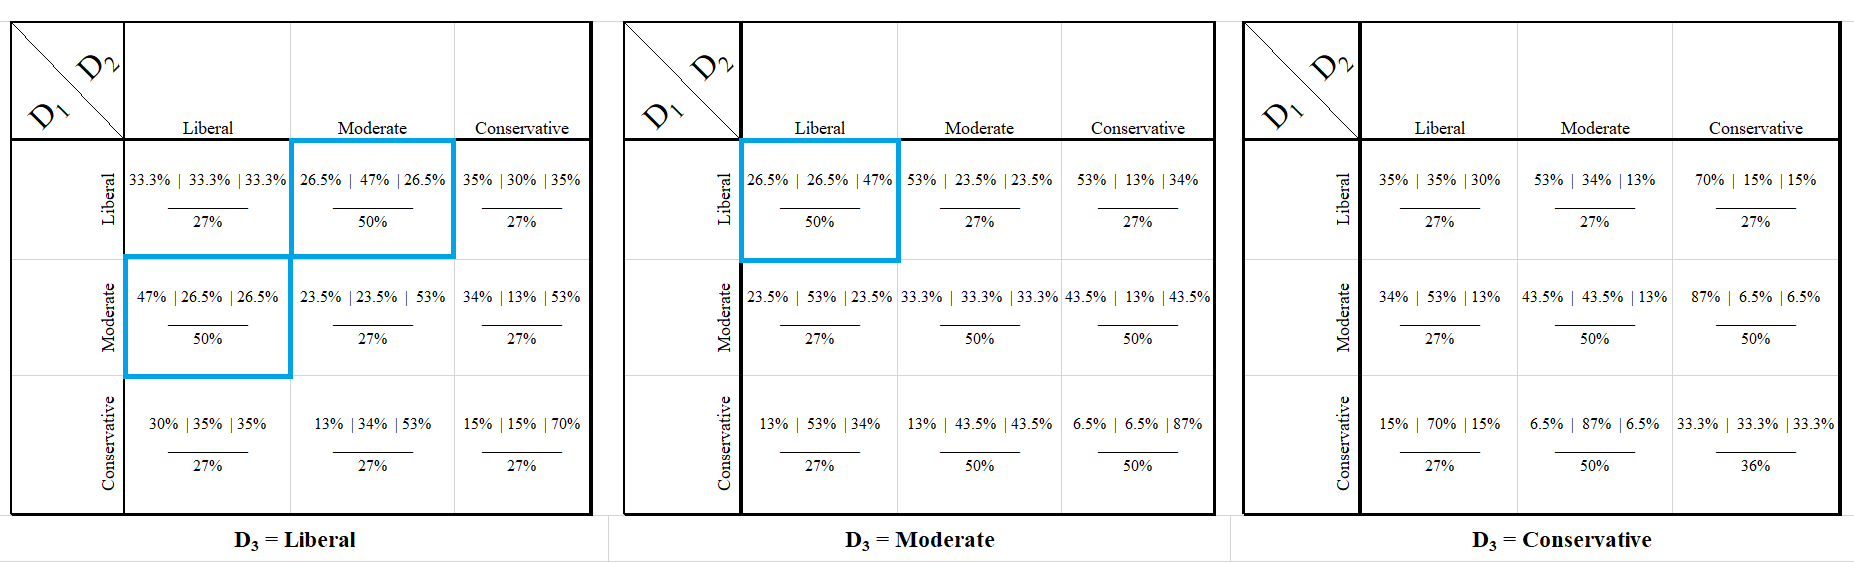
Payoff Matrix for a Three Candidate Democratic Primary with General Election Percentage Below (click for enhanced image)
The three blue outlined scenarios are the Nash Equilibria for this game, and as I noted earlier, the three-candidate scenario actually results in the best possible outcome for the party. Here, two candidates are pulled to the liberal strategy and one towards the moderate strategy, with the player playing the moderate strategy winning the game and being best suited to take the same stance in the general election. The three player game is ideal to show how complicated and intricate this becomes as the number of candidates increases, and how the Nash Equilibria and electoral incentives can work to the party’s advantage in some scenarios.
A candidate wants to play a strategy that allows them to win the primary and win the general, which in the Democratic primary is and
. The incentives often push away from this, since to win the primary a candidate must move to the left, but the party (who will lose the general election if this is the case) can construct mechanisms to alleviate this problem or direct candidates towards electoral success in both stages.
However, incumbent presidents do still sometimes lose reelection. Doesn’t that throw this entire method of analysis into doubt? As it turns out, those rare elections are actually some of the best pieces of evidence to support this version of primary analysis. This game theory application is assuming the incumbent president does not face a primary challenge, and all the incumbents who lost reelection in the post-war era all faced serious primary challenges.Gerald Ford (challenged by Ronald Reagan), Jimmy Carter (challenged by Ted Kennedy), and George H. W. Bush (challenged by Pat Buchanan) When both the incumbent party and the challenging party hold primaries, both candidates have to play two separate games again, and aligning to the moderate lane in both remains difficult depending on the number of players and how serious the challenge is.
Let’s step out of theory and fully back to reality for a minute. First of all, the way the parties choose their nominees in the primary is not strictly plurality-wins. After their electoral follies in the 1960 through the 1980s, the Democrats embraced a set of primary rules that were explicitly designed (by the McGovern-Fraser and Hunt Commissions) to generate a more moderate and palatable candidate for the general election. These include overwhelmingly (little “d”) democratic proportionate primaries generally more representative of the party at large (so that every vote matters more, as opposed to a winner-take-all system that would effectively eliminate the say of the minority of voters), superdelegates,After the 2016 election, the Democratic National Committee effectively removed superdelegates from the first round of balloting. They would kick in if no candidate receives a majority on the first round of balloting so as to provide some structure and organization in a contested convention. and moving away from state-level conventions in favor of popular caucuses and primaries. These reforms have been critiqued as being both too democratic, in that they have historically made for a drawn-out and occasionally unstructured process, as well as too elitist, in that states are awarded additional delegates for strong electoral performances for Democrats and superdelegates give entrenched Democratic leaders a hefty say in choosing nominees. The Republicans, on the other hand, often have a more accelerated primary since many states have “winner-take-all” contests. These allow a plurality-winner even in a multi-candidate race to take the cake fairly quickly by winning all of the delegates for a state they may nonetheless have won by less than an outright majority. Our simple model thus far has attempted to bridge these differences, by providing for a “plurality” winner of a primary (note the Nash Equilibria in the three-player game above), and by considering all candidates identical in all aspects other than the strategy they choose. I would surmise that this model is more applicable to a Republican primary, since its winner-take-all nature and more ideologically homogeneous voter base make for clear and well-documented electoral incentives.
So how can parties curb these misaligned incentives and set up a primary that unifies the party behind an appealing candidate that is not only representative of the party itself but also well-suited to appeal to the broader electorate? The Democratic Party’s reforms under the McGovern-Fraser Commission and Hunt Commission proposals do help, and have been relatively successful in nominating candidates who are more aligned to the political center. In fact, the proportional nature of the Democratic primary may allow for more complex political bargaining around the realities than the model I’ve presented can show: with a multi-candidate field, the chances of any candidate getting an outright majority rapidly diminishes, and candidates are forced to concede their delegates and organize themselves more efficiently, especially after the initial caucuses and primaries when it becomes clear who has plurality support and who does not. The Republicans would be well-served to do away with the winner-take-all primaries, which disproportionately discourages this general electorate-minded strategy in favor of expediency.The Republican Party did embrace some primary reforms after their 2012 election loss, but these rules still have a winner-take-all trigger in many states, especially on Super Tuesday, where a very large percentage of the overall delegates are allocated fairly early in the primary cycle. This was key in boosting Donald Trump’s performances early on in their 2016 primary at the expense of the incredibly-crowded and more orthodox candidates.
Both parties, however, could likely benefit from reforms that appeal to the political center rather than their more entrenched factions. Depending on the execution, embracing closed primaries (wherein only registered party members can vote) or open primaries (wherein independents and even members of the opposing party can vote in the party’s primary, provided they don’t vote in the other party’s as well) could be a solution. Intuition may point towards allowing open primaries, wherein the electorate-at-large can participate, but they’ve been shown to propagate political polarization and, especially in a year where there is an incumbent president – could incentivize members of the incumbent party to participate in the other party’s primary to try and nominate a less-electable opponent. Putting emphasis on party delegates rather than candidates may be another solution, and could include opting for a two-step nomination wherein the party’s delegates (which are chosen by the electorate) initially provide a well-organized and nationally-effective slate of candidates that the voters would then select from. These reforms would act as a compromise between electability in both the primary and the general by encouraging a thorough examination of the candidate’s compatibility with the general electorate, winnowing down overly-crowded fields, and would reduce the power of candidates who simply have fundraising prowess or receive more media attention.
The best solution is likely a mix of many ideas, but the game theory and median-voter theory method of analysis for the primaries has brought to mind a relatively painless and effective mechanism for improving the primaries: apportioning by the median voter, rather than the mean. Even a relatively small portion of fairly radical voters can draw a party disproportionally to the extreme, but a runoff election could help offset this by requiring voters to rank all candidates by preference and ensure that no voter’s vote is ultimately wasted. Primary voters in each state would cast their ballots by ranking the candidates in order of preference, and starting with candidates who have a threshold farthest below the vote share would have their votes allocated to those voter’s second choices, until all candidates remaining are at at least
vote share, based on the original n value during that state’s primary. This last part is important for correcting for the pervasive incentives towards polarization, and would prevent the splitting of the “moderate” strategy candidates towards a “liberal” strategy candidate or “conservative” strategy candidate, since the lower threshold for inclusion does not automatically make for a plurality winner. The n value would reduce over time as candidates drop out, and the runoff would force the voters whose candidates underperformed to have a designated second choice. So, even in cases where the “moderate” candidate is eliminated via the runoff, their voters would choose either another moderate candidate, or the liberal or conservative candidate that is closest to them, building a majoritarian rather than a plurality-wins primary.Consider a situation where five candidates keep splitting the party relatively 40%-30%-15%-10%-5% on a range from most extreme to most centrist (not dissimilar to some of early moments of the 2016 Republican primary). Here, 100%/5 = 20%, so the candidate with 5% would have their votes re-allocated, largely to the person with 10% (as this is likely their second choice), but then this candidate would also fall short of the 20% threshold, and their votes would then be allocated to the candidate originally receiving 15%, with a new breakdown of all above 20% that is (once again from most extreme to most centrist) 40%-30%-30%. The party did lose out on the most centrist candidates towards the tail end, but was able to move to a more balanced proportion, and resets expectations for the primary and for the next state. Ultimately, as candidates with lower vote shares drop out, their votes will end up going to the candidate who originally received 30% of the vote, thus preventing the most extreme candidate from winning as they otherwise might have (especially in the winner-takes-all states). This would change very little about the current primary structure other than vote allocation mechanisms, and as candidates dropped out, they’d still be able to pledge their delegates to another candidate (generally the one closest in ideology to themselves).
This is not a perfect solution, but it is one that makes a degree of mathematical sense in regards to addressing the underlying problem that is polarization within parties and misaligned incentives, while alleviating the increasing misallocation costs as the number of candidates increases. The truth of the matter, and what I’ve attempted to perhaps over-rationalize to you here, is that so long as the non-incumbent party’s candidate must face its own party’s voters and then a general election against an incumbent who only must face the general electorate, there will be dual incentives that do not often align. Democrats in 2020 should be wary, and Republicans should remember the pitfalls of their 2012 primary. Both parties have their work cut out for them in building a primary that makes a positive case for a candidate of their own against an incumbent who is not facing the same strategic considerations.