
Is East Coast Centrality Killing Us?
It’s probably an understatement to say that, out of all of America’s regions, its coasts receive the most attention. Media, economic, political, and soft power is concentrated in metropolises along America’s shorelines. Eight coastal cities — New York, Los Angeles, Washington, San Francisco, Philadelphia, Boston, Seattle, and Miami — make up over a quarter of US GDP, while New York and Los Angeles alone make up one eighth of US GDP. New York City by itself accounts for 8% of US GDP.
Of the six time zones occupied by US states, the one furthest east dominates. The stock market’s hours are set by Eastern Time, our seat of government operates on Eastern Time,Time zones are not mentioned anywhere in the Constitution, though it does say that the president’s term will end at “noon” on the 20th day of January. This has always been observed on Eastern Time. Eastern Time dictates our time-honored watching of the ball drop for the new year, and “East Coast Bias” is even a whole concept in the sports world. Sure, the New York Times may tell you that Mountain Time is the “best time zone in America,” but it’s pretty difficult to imagine the New York Times — by no means a local paper at this point — relocating anywhere, ever.
This East Coast bias can resonate in many soft ways, affecting when we can watch sports games, awards ceremonies, and the like. But there are hard consequences too. Some remote workers in other time zones still rely on Eastern Time hours, especially in parts of the financial services industry reliant on the flow of the stock market. Those in Pacific Time are 5% more likely to be awake by 7 AM than those on Eastern Time (presumably because they need to get up for team meetings with colleagues on the other side of the country). As a matter of anecdote, and for what drew me to this story, that includes myself. I work for a company in DC, but split my time between Mountain and Pacific time zones; I’ve been up at 6 AM for meetings starting at 9 AM back east.
And this may have even darker consequences — it’s been established that the part of the time zone you live in can impact your health, based on natural light from the sun. Those closer to the eastern border of their timezone experience an earlier sunset and do, as it turns out, go to bed at an earlier time than those on the western border of that timezone. The time you go to school or start to work does not generally vary by the sun, and is consistent throughout the zone you reside in. “Individuals on the late sunset side of a time zone boundary are more likely to be sleep deprived, more likely to sleep less than 6 hours, and less likely to sleep at least 8 hours,” according to a study by Osea Giuntella of the University of Pittsburgh and Fabrizio Mazzonna of the Università della Svizzera Italiana. They further found that those living on the western borders of their time zone are more likely to be overweight or obese, more likely to suffer a heart attack, more likely to develop breast cancer, and suffered from 3% lower wages than those further east in the time zone.
But if we go back to our larger premise — that the East Coast’s dominance alone may negatively impact those further and further west — can we extend this to its logical conclusion given what has been established within time zones themselves? Controlling for a number of factors, would we see an increase in premature deaths the further west we move?
Effective Time Zones
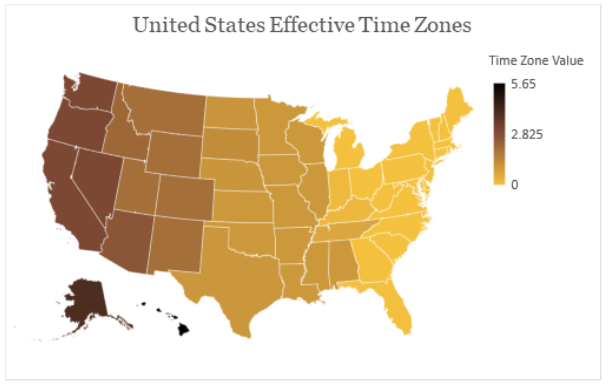
Let’s start with the obvious — as introduced at the onset of this piece, there are six time zones in the United States. To start, I assigned each a numerical value from 0 to 5, 0 being Eastern, increasing westward until we hit Hawaiian-Aleutian Time at 5. This means Mountain Time is 2, Pacific Time is 3, and so on.
But the story is a little more complicated than that — 13 states are split between two time zones, and two states just wanted to be especially different, so we have to adjust for them individually.There are several places that unofficially observe another time zone, including one town of 17 people in Oklahoma which observes Mountain Time. But because it is a de facto recognition, and the populations are small enough, they are not being accounted for in this adjustment. Kenton, Oklahoma will live to be different another day.
Alaska, Florida, Idaho, Indiana, Kansas, Kentucky, Michigan, Nebraska, North Dakota, Oregon, South Dakota, Tennessee, and Texas all have counties (or — ugh, just parts of some counties) in another time zone compared to the rest of the state. To adjust for all of these, we took the population of each county in another time zone (rounded to the full county) and applied it to the time zone it is actually in. For example — Malheur County in Oregon is predominantly (but not entirely, because what sense would that make, right?!) in Mountain Time. Its population of a little over 30,500 is applied to Mountain Time, giving Oregon an effective time zone value of 2.9925 (about 99.25% of the population of the state is in Pacific Time, a value of 3 — and about 0.75% is in Mountain Time, a value of 2). Easy enough, until you get to states like Tennessee or Kentucky, which have dozens of counties in different time zones, but we treat them the same way. About a third of Tennessee is in Eastern Time and about two-thirds is in Central Time, so Tennessee has an effective time zone of 0.66. This is why in our little map there are slight variations in those 13 states’ colors, compared to the other states which are generally squarely in one time zone.
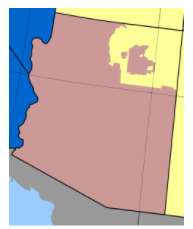
Finally, we have to adjust for two very special states: Arizona and Hawaii. Arizona is in the Mountain Time Zone but because it does not observe daylight saving time, it effectively shares its time with Pacific Time for 65% of the year. Adding to the confusion is the Navajo Nation within Arizona, which does observe daylight saving time, but includes the Hopi Reservation enclave, which does not recognize daylight saving time. So, here’s how we’re going to do this… Arizona’s total population (as of 2018) is about 7.158 million. The last accounting of the population of the Navajo Nation was in 2010 and lists a total population of 173,667, of which 101,835 live in Arizona for whom there is a rate of population decline of -2.7% in the ten years preceding. We’ll annualize that to -0.27%, times eight (as we’re using 2018 as our base year) equals -2.16%, for a total Navajo Nation population in Arizona estimated to be 99,615. Subtracting that from the total population of Arizona brings us to 7,058,385 Arizonans (which also includes the Hopi Reservation within the Navajo Nation) who do not recognize daylight saving, and so we will divide it by the total Arizona population and multiply that by 0.65 to apply to Pacific Time (as it’s about 65% of the year when Arizona is effectively on Pacific Time), and 0.35 to apply to Mountain Time. Finally, we will add 99,615 over 7.158 million to apply to Mountain Time in Arizona to account for the Navajo Nation in the state, which is 0.014. So, Arizona’s final effective time zone value is 2.641.
Last but not least is Hawaii — who also does not recognize daylight saving time, which means for 65% of the year, Hawaii is actually six hours behind Eastern Time, so… if you’re a day trader in Hawaii, during daylight saving time, you’d need to be up at 3:30 AM when the New York Stock Exchange opens at 9:30 ET. Since that’s 65% of the year, Hawaii’s effective time zone is 5.65 (this is because everyone else — except Arizona — moves up, while Hawaii stays the same).From a sunlight perspective, Hawaii is close enough to the equator that daylight hours do not change as dramatically — but we’re focusing on hourly differential from Eastern Time, so we will still count it as six hours behind for that part of the year.
Everybody happy? Hell no! But when it comes to averaging a given state’s time zone, that’s about as good as we’re going to get. Now let’s get to the good stuff!
Premature Deaths
Okay, maybe it’s not really good stuff, but we can at least start to make some observations. Using 2018 data from the United Health Foundation’s “America’s Health Rankings”, we have a baseline number of premature deaths by state per 100,000 population. These are years of potential life lost before age 75 in a given year. Let’s run a quick regression just to see how it looks on the surface, given that premature deaths is our dependent variable, and effective time zone is our independent variable.
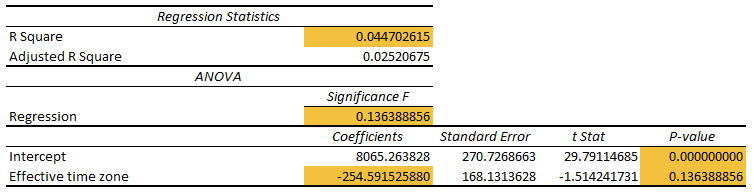
This isn’t a great starting point, but it’s not the end of the world either. For starters, our R square is only 0.044 — showing almost no variation in premortality is explained by a given increase in time zone. Furthermore, this regression is not significant to a 95% confidence interval, as our significance and P-value both clock at 0.13, rather than below the 0.05 we would need to confidently make any assertions. Finally, our coefficient for the effective time zone is actually telling us the opposite of what we might have initially predicted: a negative relationship — meaning that the further we get from Eastern Time, premortality is decreasing.
Not an ideal starting place, but our P-value isn’t too far away from under 0.05, so once we plug in a couple of sensible control variables we may have a bit more luck without overtly P-hacking the model to get what we want.
Employment and Lifestyle Differences
There are a number of things we’ll want to control for, coming from two sides of the equation: differences in employment and differences in lifestyle between states. The hypothesis we’re working with is that the farther a state’s effective time zone is from 0 (Eastern Time), the more premature deaths we might expect. Controlling for deaths per 100 million vehicle miles traveled could help illustrate lifestyle differences between the eastern states (where driving is relatively less prevalent) and central or western states (where driving is relatively more prevalent) without directly addressing health disparities (which are directly addressed in the premature death dependent variable). Controlling against specific differences in employment would be warranted too. Blue collar workers’ hours would not be affected by Eastern Time (as opposed to our Hawaiian day trader example) so controlling for the share of blue collar workers in each state may be a helpful countermeasure. In the same vein, controlling for each state’s unemployment rate makes sense as, by definition, their working hours are not affected by the Eastern Time Zone.
The Insurance Institution for Highway Safety provides data on deaths per 100 million vehicle miles traveled for 2019 — which is close enough to our basis year of 2018 that it should still provide a relevant control. We’ll grab the percentage of blue collar workers per state from CEPR’s compiled data from the Bureau of Labor Statistics (BLS) from 2015. DC is not included in this listing so I supplemented it by finding the District of Columbia’s labor data from the Bureau of Labor Statistics and calculating the share of blue collar workers (DC has the smallest percentage of blue collar workers of any state, only 4.35% in 2015). Finally, we’ll use BLS’ average unemployment rate per state in 2018 as our data for unemployment. Let’s run another regression with our three control variables:
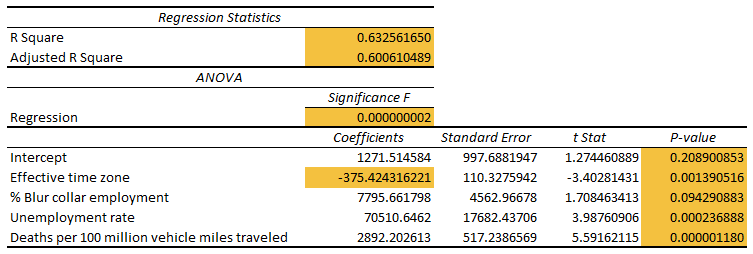
Much improved — our regression is significant and explains 60% of the variation in premature deaths (switching to using “adjusted R square” to determine this, given our multiple control variables). Effective time zone is significant, as is the unemployment rate, and deaths per million vehicle miles traveled. Blue collar employment is close, but no cigar. What’s most interesting is even with a dramatically-improved regression, the effective time zone variable is even more negatively correlated with our dependent variable — every increase in time zone is actually decreasing premature deaths per 100,000 by 375.
Let’s strip out the percentage of blue collar workers control and run it one last time:
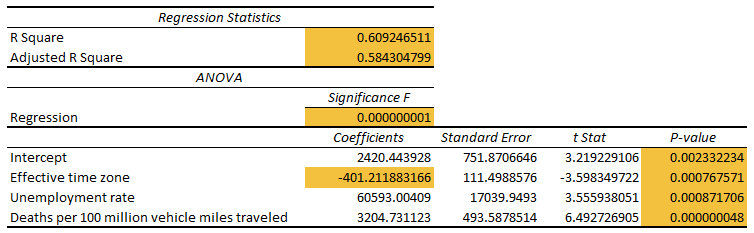
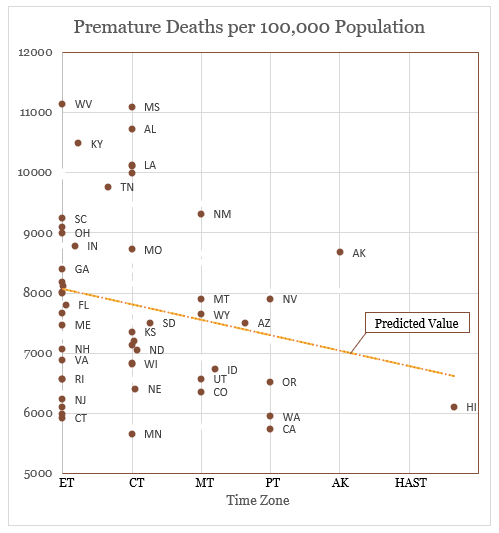
Our adjusted R square indicates that our variables explain 58% of the variance in premature deaths — a moderate correlation — and the effective time zone is now even further decreasing premature deaths (a decrease of 401 per increase in time zone). Now that our variables all seem pertinent and we’ve got a reasonable correlation, we can establish our regression equation and plot our data along our predicted values given effective time zone:
Premature Deaths out of 100,000 population = D
Effective Time Zone = ETZ
Unemployment Rate = U
Deaths per 100 million vehicle miles traveled = DVMT
D = 2420.44 – 401.21(ETZ)+60,593(U)+3204.73(DVMT)
Though it’s not a major contributor to premature deaths, our relationship remains negative. All else being equal, the further west the effective time zone is, the fewer premature deaths would be expected. This is contrary to the initial prediction, but a bit of intuition and a glance at the chart we’ve derived from the regression may provide two hints as to why.
West Coast, Best Coast
California, Hawaii, Washington, and Oregon all have dramatically fewer premature deaths than they’d be expected to. Of states with an effective time zone of Pacific Time or more, only Nevada and Alaska have higher than predicted values of premature deaths per 100,000 people. When we apply a binomial line of best fit to the expected data points in lieu of a linear one, you can see where I’m going with this.
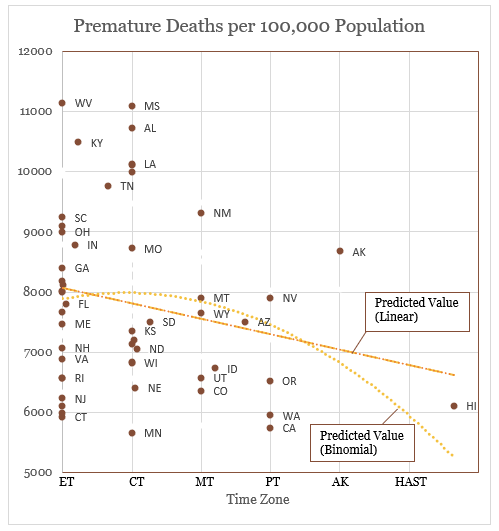
Forget East Coast centrality… coastal centrality in general may be killing us. Could the competing coastline powers — competing cities, industries, and spheres of influence — with their own compelling sway, be responsible? Is the rest of the country disadvantaged because the East Coast and the West Coast are engaged in an everlasting struggle to dictate their whims on the nation at large?
That is one explanation which deserves exploration. But if you take a closer look at the data you may notice a pattern in states above and below the predicted value: the overwhelming majority of states with more premature deaths than expected are dominated by conservatives, and the overwhelming majority of states with fewer premature deaths than expected are dominated by liberals. That the coasts are run by Democrats and the middle of the country by Republicans is not news, but the few outliers may actually give it further credence: Minnesota and Colorado, two Democratic-leaning states, stand out in Central and Mountain time zones respectively — while West Virginia, South Carolina, and Kentucky, all Republican-leaning states, are far above what would be expected in Eastern Time.
Maybe time zones are a proxy for something more insidious — we’ll have to adjust for both coastal dominance and relative partisan lean of every state to find out.
Stay tuned for part two of this piece, on whether coastal centrality is killing us, or whether a state’s partisanship is responsible.