What if Trump Ran as a Third Party Candidate in 2024?
It’s May of 2024 and former Vice President Mike Pence appears to be the likely Republican nominee, despite Donald Trump’s victory in the Iowa caucuses only a few months earlier. He comes out just ahead of the former president as the Republican Party’s establishment manages to rally together around a unifying candidate who talks about something other than stolen elections and Trump’s supporters fail to turn out, facing headwinds voting in a number of states that have made casting a ballot more difficult. Pence begins the gruelling march towards the general election in November, where he will face incumbent President Joe Biden, who cruised to renomination as he was unopposed in the Democratic primaries, many of which were canceled.
As the August RNC, where Pence will officially accept the GOP’s nomination and name former UN Ambassador Nikki Haley as his running mate, approaches, rumors have been building that a disgruntled Trump will counterprogram Pence’s speech with one of his own. And sure enough, on that fateful day in August in a speech at Raymond James Stadium, Trump announces he will run for president on a newly formed Patriot Party ticket with South Dakota Governor Kristi Noem as his running mate.
This is the scenario I ask you to imagine as we conduct this exercise on an alternate political future, one in which Democratic President Joe Biden is challenged by Republican Mike Pence and the Patriot Party’s Donald Trump, each on the ballot in all 50 states, the District of Columbia, and the five congressional districts that vote independently of their statewide results.Maine and Nebraska’s congressional districts cast votes for president separately. The last time something comparable happened was 1992, when President George H.W. Bush was challenged by Democrat Bill Clinton and independent Ross Perot. Clinton won the election with 43% of the vote nationally, with Bush at 47% and Perot at 19%. Perot won no electoral votes. But another comparison would be the 1912 election in which incumbent Republican President William Howard Taft was challenged not just by Democrat Woodrow Wilson, but by his Republican predecessor too. Now running as the Progressive (or “Bull Moose”) nominee, former president Theodore Roosevelt decimated Taft’s incumbency advantage and surpassed his vote margin, carrying several states and around 27% of the vote (Taft — the incumbent president, may I remind you again — casrried only two states and just 23% of the vote!) This enabled a blowout Wilson victory, despite the fact he only carried 42% of the vote, and the prospect of a former president challenging his own party makes for a slightly more apt comparison, hinting at the results you might expect.
So in 2024, imagine a former president incredibly popular with his base, an incumbent president carried to victory four years prior on the backs of independents and moderates, and a mainstream GOP candidate divorced from the driving force in the party the last eight years. How does that play out?
The Model
Our best base-level guidelines for state-level vote share for each candidate in this three-way race are a confluence of six variables:
- Biden’s 2020 vote share in each state: simple enough, this is the percent of the vote Biden got in every state in the 2020 election.
- Trump’s 2020 vote share in each state: percent of the vote Trump got in every state in the 2020 election.
- Biden’s 2020 vote share overperformance compared to Democratic congressional candidates: Biden won nationally by 4.5%, but House Democrats won nationally by 3.1%. This 1.4% margin of overperformance by Biden seems minute, but almost certainly won him the election — Georgia, Arizona, Wisconsin, and Pennsylvania, which all went for Biden (and delivered the election for him), were won by less than 1.4%. Had Biden been a “generic Democrat” he likely would have won the most votes but lost the Electoral College. This also helps us unpack the inverse — are there Trump-sceptical Republicans who voted for Republicans in House races but didn’t support Trump?
- Partisan lean: the partisan lean of each state and district, reflecting the leaning of a state in a neutral political environment, courtesy of FiveThirtyEight.
- Trump’s PARP score: this stands for “popularity above replacement president,” a handy metric FiveThirtyEight created to illustrate where the president was under- or overperforming his predicted popularity. For example, Trump was always uniquely weak in states like Kansas and Utah, which are heavily Republican states, but where his net approval was only 2% and 5%, respectively. This gives us a guideline of how many voters in states might be conservative but opposed to Trumpism. This is calculated by taking the net approval of Trump in each state plus the state’s partisan lean.
- Republican approval of Trump: an average over 2017-2021 of Republican approval of Trump, this is 86%.
With these six variables we can assemble the model of vote share in each state:
- Biden’s vote share is calculated as his 2020 vote share in each state minus his overperformance compared to the generic Democrat. Critically, Biden is only harmed by this model. He can never get a higher share of the vote than he did in 2020.
- Trump’s vote share is calculated by first finding his average approval amongst Republicans (0.86) plus his PARP, then multiplying that number by his 2020 vote share in each state. Trump has the opportunity to exceed his 2020 vote share if his PARP score in any given state is above 14% (since retaining 86% of his voters is the default assumption based on his popularity among Republicans). He must be demonstrably more popular than expected given a state’s partisan lean to do so, which he is not in any state — he is far more popular than expected in Hawaii, but the PARP there is only around 10.7%, so he’s still losing voters to the Republican candidate overall.
- Finally, the GOP’s share of the vote is calculated by subtracting the 2024 Trump vote share from his 2020 vote share in each state, before adding Biden’s overperformance of 1.4% (as these are presumably voters who picked Biden for president over Trump, but still voted Republican for Congress). The GOP carries more voters when a state is Republican leaning but Trump is far more unpopular than expected in the state, suggesting a larger share of Republicans would prefer a more mainstream candidate.
For the Nebraska and Maine congressional district vote shares, and DC vote share, for which PARP data was unavailable, a PARP of zero is assumed, so Trump carries 86% of his vote share in 2020, with the other 14% going to the GOP candidate.
The Results
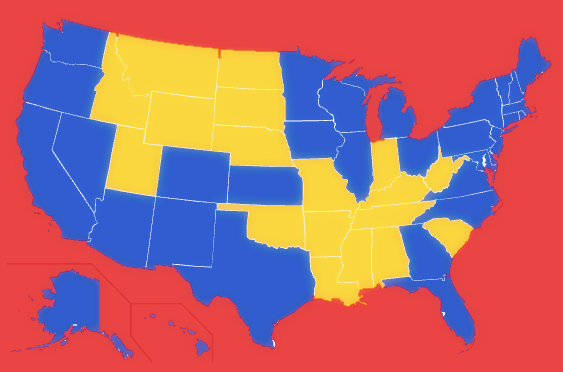
It is perhaps not surprising if you know anything about third parties in the US, but Biden easily carries this election because the GOP splits votes away from Trump. You can click on the map to see the results in each state or district:
|
|
|
| 49.9% of the vote 421 electoral votes |
37.01% 117 |
11.28% 0 |
Biden carries every state he did in 2020 and picks up an assortment of other states totaling 421 electoral votes. Biden’s demonstrable plurality provides a margin large enough to pull off a victory in states moving away from Democrats like Florida, Iowa, and Ohio. It also allows Biden to pick up states moving towards Democrats despite still being varying shades of red, such as Alaska, Kansas, Texas, and North Carolina. The tipping point state — the state which provides Biden his critical 270th electoral vote — is Pennsylvania, a state he carries by a comfortable 8.5%.
Trump’s popularity manages to deny the GOP a plurality of the vote in any state. The closest the GOP gets is in North Dakota, where they carry 28.9% of the vote, still about 9% below Trump and about 1% below Biden. The GOP does score one second-place finish in Wyoming, where Biden receives only about a quarter of the vote. But overall, Trump’s base holds steady, and Trump carries states and districts totaling the remaining 117 electoral votes — a total weaker than any second-place party since 1988, when George H. W. Bush defeated Michael Dukakis by 426 electoral votes to 111.One remaining electoral vote went to Dukakis’ vice presidential running mate, Lloyd Bentsen, which we covered in our Running Mates podcast episode on the Bentsen v. Quayle race.
Estimating the Popular Vote
Calculating the national popular vote is tricky since this is a state-level model, but by averaging two possible predictions we can soundly estimate. For the first estimate, we can work from the top down by applying our formula to the national numbers from 2020; this gives us 49.9% for Biden, 36.75% for Trump, and 11.55% for the GOP. For the second estimate, we’ll work from the bottom up and compare the vote share of each state relative to the national vote share in 2020, multiplying that share by each candidate’s vote share for a more specific (but less flexible) estimate; this gives us 49.9% for Biden again, 37.26% for Trump, and 11.01% for the GOP. These two estimates are very close, so by averaging the results we can walk away with a comfortable guess, but the topline is obvious: Biden wins the popular vote by a wide margin, while the GOP splits over 10% of the vote away from Trump.
Swing States
There are 18 states and districts in which the margin was less than 7.5%:
| State/District | Biden % | Trump % | GOP % | Victory Margin |
| Arkansas | 33.38% | 40.66% | 23.14% | Trump/Biden +7.28% |
| North Dakota | 30.36% | 37.61% | 28.90% | Trump/Biden +7.25% |
| Mississippi | 39.66% | 45.91% | 13.09% | Trump/Biden +6.25% |
| South Dakota | 34.21% | 39.38% | 23.79% | Trump/Biden +5.17% |
| Utah | 36.25% | 41.09% | 18.44% | Trump/Biden +4.84% |
| Indiana | 39.56% | 42.78% | 15.64% | Trump/Biden +3.22% |
| Montana | 39.15% | 40.99% | 17.33% | Trump/Biden +1.84% |
| South Carolina | 42.03% | 43.74% | 12.77% | Trump/Biden +1.71% |
| Maine 2nd | 43.42% | 44.94% | 8.72% | Trump/Biden +1.52% |
| Nebraska | 37.77% | 39.10% | 20.52% | Trump/Biden +1.33% |
| Missouri | 40.01% | 41.33% | 16.87% | Trump/Biden +1.32% |
| Alaska | 41.37% | 40.35% | 13.88% | Biden/Trump +1.02% |
| Kansas | 40.16% | 38.96% | 18.65% | Biden/Trump +1.20% |
| Texas | 45.08% | 42.18% | 11.28% | Biden/Trump +2.90% |
| Ohio | 43.84% | 39.23% | 15.44% | Biden/Trump +4.61% |
| North Carolina | 47.19% | 42.54% | 8.79% | Biden/Trump +4.65% |
| Florida | 46.46% | 41.69% | 10.93% | Biden/Trump +4.77% |
| Iowa | 43.49% | 37.86% | 16.63% | Biden/Trump +5.63% |
To be clear, even if Trump had won each of these states, he still would have lost this election to Biden, who would have won 303 electoral votes. In this scenario, Biden and Trump each win exactly every state they did in 2020 (the difference in the electoral vote total from 2020 is a reflection of state’s allocations changing thanks to the 2020 census).
So Is This Going to Happen?
No! There is absolutely no reason for Trump to leave the Republican Party. He controls its apparatus, exerts incredible influence over their elected officials, and anti-Trump Republicans represent an ever-shrinking share of the party’s leadership. Many anti-Trump Republicans simply left the party, were replaced by pro-Trump Republicans at the elected level, moved into the sidelines, or became Democrats. So, there’s not much institutional power against Trump at this point. Trump has effectively steered control of the GOP in his support and exorcised or relegated moderate Republicans who oppose him. The mere threat of him forming his own party is probably enough to scare Republicans into supporting him — otherwise they face an electoral defeat of epic proportions, as this model demonstrates.
If there is a second takeaway from this exercise and electoral model it is in what it can illuminate beyond the veil of our modern political landscape. North Carolina and Texas are obvious future pickups for Democrats, and this shows that it doesn’t take much to push them squarely into the Democratic corner. But Alaska? Kansas? We’ve sung the praises of Kansas’ subtle flirtations with Democratic politics before. And if 40,000 Democrats moved to Alaska… about the size of the town of Post Falls, Idaho… it would become an incredibly competitive swing state. The electoral prospects in the United States may be entrenched and partisan, but the electoral possibilities in America are many. Stranger things have happened.