The 2020 Vice Presidential Tracker
It may feel like the 2020 Democratic primary has been going on forever, but voters will finally have a say in who the eventual nominee will be in under a week at the Iowa caucuses. This first real contest between the candidates will officially begin the onslaught of state contests, delegate counts, and candidate dropouts that will all lead up to the eventual selection of the party’s nominee – either through the candidate security a majority of the delegates via the ballot box, or in a contested convention.
Every website, newspaper, and writer that covers politics will be tracking the delegate counts, the individual state contests, candidate dropouts, endorsements, the debates (don’t worry – there are so many more!), and the nuances therein in the march towards selecting the final nominee. Voting hasn’t even started yet, and there’s already so much available on the content on the candidates, be it through betting markets placing odds on who the nominee will be, poll aggregators, and sites tracking endorsements. We’ve decided to take a more niche approach to the primary and cover something that won’t happen for some time but should be in the back of everyone’s mind throughout this process: who the eventual nominee will choose as their vice presidential running mate.
We’ve covered the vice presidency a couple of times here at The Postrider, and even have a podcast dedicated solely to their electoral implications, but it’s an often overlooked subject and we’ve intentionally spent a lot of time focusing on it for that very reason. With the whole world’s eyes on the Democratic primary this spring, the vice presidential selection is a specific and unique enough lens to view this process through, and it will add additional context to who the Democrats choose as their ticket to represent themselves in the general election this fall. This year, we are covering it primarily through the 2020 Vice Presidential Tracker, an aggregator and tool we’ve spent several months developing and tuning. The tracker allows users to select a potential nominee and provides them with a breakdown of the most effective choices for that candidate’s running mate based on a measure we’ve called the “VP Score”. It also aggregates an overall standing rank, based on who is most likely to be the vice presidential nominee given who is most likely to be the presidential nominee. When the primary votes start coming in and delegates are allocated, this will become more and more rigorous and a more effective prediction given that certain candidates will separate from the field as more likely nominees.
One important caveat, this methodology has been built specifically for the Democratic Party’s VP selection. The same formula, aggregator, and tool will not work (by intention) for the Republican VP selection. The parties have very different voting blocks, backgrounds in past nominations, and preferences for national candidates – not to mention a different delegate allocation structure for the eventual nominee – and the VP tracker takes all of these things into account In the future, we hope to develop a tool that would predict the likely vice president in a competitive Republican Primary as well.
The tracker will update frequently throughout the primary process as more polls and then votes come in, so stay tuned to that page for updates and feel free to play around. If you’re interested in the methodology, keep reading!
Methodology
Candidate Inclusion
Presidential candidates are included if they are actively running for president and have met one of the following two qualifications:
- They qualified for the seventh Democratic debate, so please welcome to the tracker: Joe Biden, Pete Buttigieg, Amy Klobuchar, Bernie Sanders, Tom Steyer, and Elizabeth Warren.
- They are polling at above 3% according to FiveThirtyEight’s national polling average. Good job Andrew Yang and Michael Bloomberg!
VP Inclusion
Potential vice presidential choices are included if… they are anyone you want them to be! So long as they are eligible to be vice president (they have not served more than six years as president, they are at least 35 years old, are a natural born American citizen, and must have lived in the United States for 14 years), they can be added to the tracker. I worked with the politically-minded The Postrider Editor-in-Chief Michael Lovito to put together a list of just over 50 names who we thought were particularly likely to be on a long list for any potential Democratic presidential nominee, and a couple of fun ones just to test the tool.Sorry Jon Stewart and Howard Schultz, but at least we know the tool is making good picks. If you’d like us to add a name, shoot us a line at the “Contact Us” at the bottom of our About Us page.
VP Score
On to the nitty gritty, here’s how an individual potential VP score is determined. It starts with the nominee, for whom the data is their:
- State
- Gender
- Race (this is a binary, a score of “0” if they are caucasian; a score of “1” if they are any other race including Latinx)
- Years of federal government experience (ex. as a congressman, senator, cabinet secretary, vice president, high level military command, etc.)
- Years of non-federal government experience (ex. as a governor, state representative, general military service, etc.)
Taking that data for a given nominee, it runs through every single potential VP choice, for whom the data is their:
- State
- Their state’s number of electoral votes
- State margin, or the partisan lean of their state plus the generic ballot (positive number is leaning Republican, negative number is leaning Democrat; this is taken from FiveThirtyEight’s open source partisan lean data and is “the average difference between how a state or district votes and how the country votes overall, with 2016 presidential election results weighted 50 percent, 2012 presidential election results weighted 25 percent and results from elections for the state legislature weighted 25 percent.” If they update this for the 2018 midterms and so forth in the coming year we will do an update to the tracker. The generic ballot lean, which is to what degree the national headwinds are tilting towards the Democrats in general on the congressional ballot is then added to this, also courtesy of FiveThirtyEight – seriously, we love them so much. So, for example, if the state has a lean of -2 (2 points more Democratic) and the generic ballot has a lean of -5 (5 points towards the Democrats), then the state margin is -7.)
- Gender
- Race (this is a binary, a score of “0” if they are caucasian; a score of “1” if they are any other race including Latinx)
- Reelection year (if you are currently in office, this is the next year you are up for election if you are not currently in office, or if your state allows you to run for two offices at once, this number will be “0”)
- Years of federal government experience (ex. as a congressman, senator, cabinet secretary, vice president, high level military command, etc. Note that if they are currently in office this will include all of 2020 as a year, so a representative first elected in 2012 that took office in 2013 and would presumably serve until January of 2021 will have 8 years)
- Years of non-federal government experience (ex. as a governor, state representative, general military service, etc.). Combining years of federal experience with years of non-federal experience results in total experience.
- Minimum viable office (this is a binary, a score of “0” if they do not meet the “minimum viable office” standard of more than 8 years as a member of the House, any service as a Senator, cabinet member, or military command, or as a governor, a score of “1” if they do)
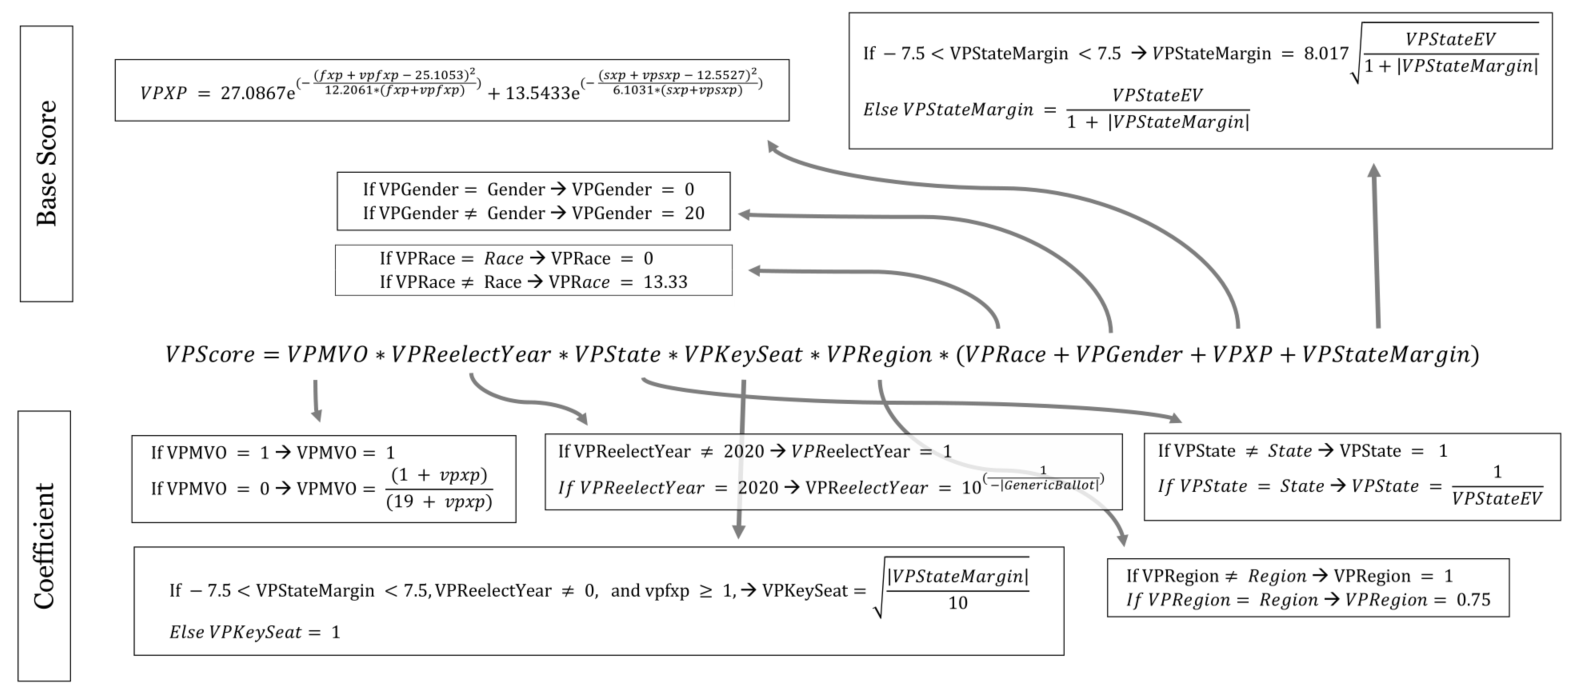
With all the variables, it will run all of the possible vice presidential picks for a given nominee, and determine a “VP Score”, which is the strength of the ticket based on an equation that is easiest to describe by breaking it down into two key parts: the “coefficient” and the “base score”. The coefficient is the values multiplied together that are composed largely of “if this, then reduce the overall score; the base score is what makes up the increases in the score. The base score multiplied by the coefficient gives the final score.
The Coefficient
The coefficient has five components all multiplied together:
VPMVO: This is the minimum viable office adjuster. If a VP choice meets the standard, it receives a value of “1” (because this leaves the core score unaffected, this will be the case with all of the variables in the coefficient). If they do not, this value is calculated as (1 + total years of experience) / (19 + total years of experience). This 1/19 base value was selected because out of the 19 vice presidential picks (excluding incumbent vice presidents) since 1968, only one (Geraldine Ferraro, Walter Mondale’s pick in 1984) did not meet this qualification. We use 1968 as the base year throughout this project because it represents the fundamental turning point in how American presidential primaries are carried out in modern times and it lets us start with no incumbent president running at the top of the ticket. Because total experience is added on to the numerator and the denominator, this number can reasonably increase if enough lower-level experience starts to add up, but always remains a detractor.
VPReelectYear: If a potential VP is not up for reelection in 2020, choosing not to run for reelection, or they can run for two offices at once, this has a value of “1”. However, if those do not apply and they’re up for reelection in 2020, then this is calculated as 10 to the power of one over negative the absolute value of the generic ballot score. So if the generic ballot is closer, it becomes far less wise to put the candidate on the ticket at the risk of losing their seat (keep in mind, if the generic ballot is closer, they’re also far less likely to win the presidential election as well). However, if the generic ballot is looking like a blowout, this number approaches 1.
VPState: This one seems redundant, but essentially it boils down to this: your vice presidential pick should not be from the same state you are. Pragmatically because the state of the pick does have a small impact, and electorally because electors from one state are forbidden from voting for two candidates from the same state on their ballot. You’d be forfeiting a given number of electoral votes, possibly ending up with a situation where a president or vice president were elected without the other.
If you love political hypotheticals – this almost happened in the year 2000, both George W. Bush and Dick Cheney were registered in Texas, but Cheney changed his registration to Wyoming before the election. The electoral vote was close enough where this would have deprived Cheney the vice presidency (at least initially) and required the Senate to choose a vice president.If you’re from different states, you get a value of “1” again; if you’re from the same state, then this number will be one over the electoral votes of the VP pick’s state. I do this because it still cuts the score by a lot (the minimum electoral votes a state can have is 3, which still brings it to a total score reduction of two-thirds) but not all states are created equal and technically, having two candidates from California (55 electoral votes) or Texas (38 electoral votes, see footnote above) would be immensely stupid, whereas having two candidates from Rhode Island would be… still pretty stupid, but hey maybe you really, really want those key four electoral votes from the Ocean State… for one of you.
VPKeySeat: Thank God for Ohio Senator Sherrod Brown. He and he alone is responsible for this variable. This attempts to address the strategy in deliberately not picking an otherwise near perfect vice presidential candidate. Brown is not up for reelection in 2020 (unlike Alabama Senator Doug Jones), he’s from a massive, somewhat Republican-leaning state that could go blue and seal the election for the Democrat, and he’s got lots of state and federal experience. So he seems like a perfect pick, right? Wrong! If Brown was on the ticket and Democrats won the 2020 presidential election, Democrats would soon regret their choice, because someone would then have to take Brown’s Senate seat and in an otherwise Republican leaning state, that person would likely be a Republican as well, which would give the Democrats one fewer seat in the all-important Senate.
So, thanks for providing us that niche example, Sherrod, and here’s what we can do about it: if a VP choice’s federal experience is greater than one, their reelect year is not “0” (this means that they are not running for reelection at all), and their state margin (remember this is the partisan lean plus the generic ballot) is between -7.5 and 7.5 (any race that is within this margin would make it at least somewhat competitive), then this is calculated as the square root of the absolute value of the VP state margin over 10. This allows a great pick to be exponentially weaker if their state’s margin is too close, but doesn’t hurt them too drastically if their state’s margin is safer, while still providing a slight disadvantage in picking them. If this situation does not apply, the score is, once again, a simple “1”.
VPRegion: Regional balancing is a thing most presidential campaigns strive for, so that they can claim to be representative of that nation as a whole instead of one particular region. For the sake of this project, we are using the US Bureau of Economic Analysis’ regions, since they are representative of the economic, political, and culturally similar areas of the country, but remain large enough to summate the nation in eight different slices. These regions are by no means perfect. Alaska has very little in common with California culturally or politically; nor does Florida share a great abundance of economic similarity with West Virginia; but they do pretty effectively capture what the more modern understanding of “regions” seems to be, unlike the US Census Bureau, say, which considers Maryland and Delaware part of the South.
Using the BEA regions, we found only two times since 1968 where the president and new vice presidential pick (incumbent tickets are excluded) are from the same region: Richard Nixon (NY) and Spiro Agnew (MD) in 1968, and Bill Clinton (AR) and Al Gore (TN) in 1992. Though I do note both of those campaigns did go on to win the general election, Nixon-Agnew lost a majority of the states in the Mideast region, and Clinton-Gore only got half of the states in the Southeast region. Conventional wisdom favors regional diversity, and thus if the regions are not shared, the value here will be “1”, but if they are shared it is reduced to “0.75” to reflect that a campaign could hope to appeal to at least two of eight regions (or 0.25) leaving at worst six of the other eight (0.75) regions off the table by default.
Multiply all of these together and you’ll get the coefficient half of the equation to determine the VP Score.
The Base Score
The base score has four key components all added together; they constitute the core score that is then reduced by the coefficient. In theory, a perfect candidate would have a base score of 100: 40.63% based on complementary experience (which is a major consideration in selecting a running mate), 26.04% based on the competitiveness and importance of the VP pick’s state (which can help, but doesn’t often make a major difference), 20% based on gender diversity, and 13.33% based on racial diversity. I’ll explain more why these are allocated as such in the individual descriptions.
VPRace and VPGender: If the nominee and the VP choice have the same race value (remember, this is binary), VPRace receives an input of 0. If they are different, it receives a score of 13.33. If the nominee and the VP choice have the same gender value, VPGender receives an input of 0. If they are different, it receives an input of 20.
I’ll be candid, the need for racial and gender balancing on the ticket is relatively new, so there’s not enough data to make much more than an educated guess as to how much it will matter. My inclination is that race matters about two-thirds as much as gender, because women make up a larger constituency of the Democratic Party (60%), and they obviously overlap with other demographics (50% of black voters – who already make up about 20% of Democratic voters – are also women). Because Latinx voters and Asian voters combined also make up about 20% of Democratic voters, and gender issues have been at the forefront of the Democrats’ agenda for the last few years, there will be immense pressure placed on the modern Democratic Party to have a diverse ticket, and I am inclined to agree that a ticket with a woman or person of color on it is more likely and stronger than one without.
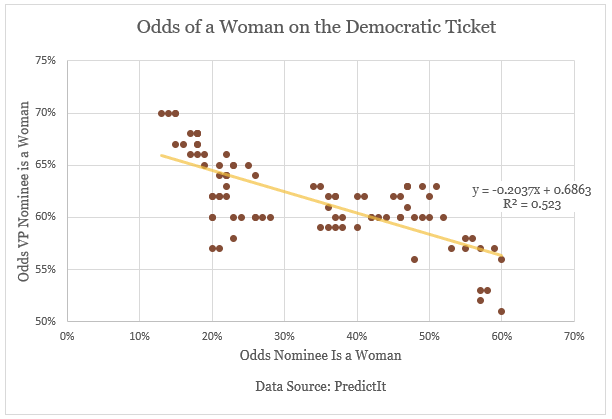
However, to make it a bit more objective considering this has only been a consideration in recent years, I pulled from PredictIt’s (a betting site) odds for a Democratic presidential or vice presidential nominee to be a woman from the last 90 days (as of January 8th), and ran a regression using the odds of a woman being the presidential nominee as the independent variable and the odds of a woman being the vice presidential nominee as the dependent variable. With a 95% confidence interval, there was a significant negative relationship, with about 52% of the variance of the odds of a vice presidential nominee being a woman determined by the odds of the presidential nominee being a woman. The equation for the regression line was OddsVPWoman = -0.2037 * OddsNomineeWoman + 0.6863. This indicates that common wisdom assumes about a 69% chance of a woman being the vice presidential nominee if the presidential nominee is not a woman, but for our purposes we’re actually going to use the regression coefficient of -0.2037, which gives us the change given if the nominee is a woman (x = 1) or if the nominee is not a woman (x = 0), giving us a roughly -20% decrease between the two.
We use this 20% as the basis for how much weight we give the requirement of one woman on the ticket because it is the determinant of change between whether there is or is not a woman on the ticket from the regression. An imperfect measure but the best option considering the relative recency of this consideration for the Democratic ticket. As noted earlier, we’ve weighted race by two-thirds as much as gender if for no other reason than there is no predictive data on this, and because women make up 60% of the Democratic electorate and racial minorities make up 40% (there is obviously overlap), so race receives a weight of 13.33.
VPXP: Arguably the most complicated and most important measure, this can make up up to 40.63% of the base score. That’s an oddly specific number, you may note, and that’s because we know that complementary experience and the state margin must add up to two-thirds of the total score; as gender and race account for a third of the score. I allocated these two by looking at every unique vice presidential pick from 1968 and the combined federal experience with the presidential pick (in years) and how many times the VP pick was from a competitive state.
We’re using the same standard as this NPR article, which describes a swing state as any state that had a margin of <5% between the two candidates in any two of the four elections chronologically closest (before or after) a particular election year, as well as the election itself. Mike Pence (Indiana), for example, is not a swing state pick, even though there was one election (2008) in which it was won by a margin of less than five percent.The VP pick was from a competitive state nine times out of 19 unique picks (47.37% of the time); and the combined federal experience averaged 25.1053. I ran descriptive statistics on the combined federal experience in years to find a standard deviation of 12.2061, and went one standard deviation on either side of the mean to find an acceptable level of combined federal experience (that would, under the empirical rule, capture about 68% of all presidential tickets, which determined that 14 out of 19 presidential tickets had a combined federal experience within one standard deviation from the mean. This implies that experience is about 1.56 times more important in picking a VP than picking one from a competitive state. Since these both must fit into the remaining 66.67% of the base score, this requires VPXP to be weighted at 40.63% of the base score, and VPStateMargin to be weighted by 26.04% of the base score.
VPXP is calculated in two parts, using the presidential and vice presidential candidates’ combined federal experience and their combined non-federal experience. Recall the average combined federal experience is 25.1053 years, and the standard deviation for that was 12.2061; meaning that under the empirical rule, 68% of values must lie within one standard deviation of the mean. The reason it is not just simply one standard deviation below the mean (and continuing to increase the score the more combined years the ticket has) is because there appears to be diminishing marginal returns in having a ticket with too much experience, otherwise most presidential tickets would have combined federal experiences well into the 40s or 50s. The experience, instead, more closely follows a normal distribution, where there is an increasing benefit up to a point, and then a decreasing benefit. This is also a good proxy for age, as two candidates on the ticket with 40 years of federal experience each would constitute an unusually elderly ticket, something that has received a lot of attention in this election. The formula for determining the experience score is composed of two parts: combined federal experience and combined non-federal experience. Federal experience is weighted twice as much as non-federal experience (meaning it is weighted by 27.0867 compared to non-federal experience’s weight of 13.5433, so that a perfect score in both would result in the 40.63 that the total VPXP value is worth in the base score. The formula for both comes out to:
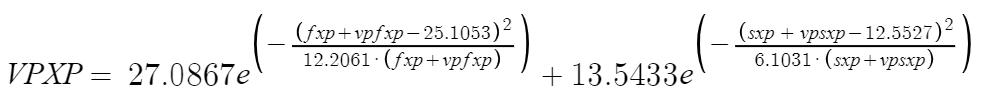
Where e is the mathematical constant multiplied by 27.0867 in the first half for the federal experience weight; and by 13.5433 for the non-federal experience weight, and federal experience is taken to the power of the candidate’s federal experience (fxp) plus vice presidential candidate’s federal experience (vpfxp) minus the mean squared, over the standard deviation times the sum of the candidate’s federal experience and the vice presidential candidate’s federal experience, all multiplied by negative one. Non-federal experience is to the power of the candidate’s non-federal experience (sxp) plus vice presidential candidate’s non-federal experience (vpsxp) minus half the federal mean (as we’re weighing it by half) squared, over half the federal standard deviation (once again, because we’re weighing it by half) times the sum of the candidate’s non-federal experience and the vice presidential candidate’s non-federal experience, all multiplied by negative one.
VPStateMargin: Last but not least is the VPStateMargin, weighted by 26.04% of the total base score.The reasons for this are discussed above in VPXP, but it boils down to complementary experience being valued by 1.56 times opting to pick a vice presidential candidate from a competitive state. If a VP candidate’s state margin (this accounts for the generic ballot) is between -7.5 and 7.5, then the VPStateMargin is the square root of the vice presidential candidate’s state’s number of electoral votes over one plus the absolute value of their state margin. This is multiplied by the most competitive average electoral vote adjuster, which was determined by taking the total number of electoral votes (538) over the total number of states (51 including DC which has three electoral votes), which is 10.55, over a perfectly competitive state (assuming a state margin of 0), which is a value of 1. The square root of which is 3.2481, which must be multiplied by 8.017 to equal the weight for this factor of 26.04. So 8.017 is the multiplier. This score gets higher if the state they are from has a large electoral vote count and has a very narrow margin. Yes, this technically does let it exceed far over 26.04 in cases where a state with a lot of electoral votes is going to be extraordinarily close, and indeed, if California (with 55 electoral votes) had no partisan lean, picking a vice presidential candidate from California would be a very smart thing to do, so this can give this factor a bit of a step up if something is a no brainer.
If the VPStateMargin is not between -7.5 and 7.5, then the state is not considered competitive for the sake of this value, and it is simply calculated as the VP state’s electoral votes over one plus the absolute value of the state margin. In reality, this is how California falls, with 55 electoral votes over 1 + 30 (California is a D +24 state, and the generic ballot at this time shows a national lean of 6 points Demoratic). Picking a VP from California would increase your score by a tiny 1.77 points.
If you add these four factors together, you’ll have the base score. Multiply the coefficient by the base score to get the VP Score for a given nominee and VP nominee combination. If you choose a nominee it will run this function for every possible VP nominee:
Overall Rank
The other side of the tool has a ranker, which is a judgement of how strong a particular vice presidential nominee selection is, based on who the most likely presidential nominee is. What this does is run the VP score for every possible vice presidential pick for every potential presidential nominee and weights them by the odds of a given presidential candidate winning the nomination; then adds them up so they’re reflective of their overall odds to win a majority of delegates in the primary. The presidential candidate’s odds are pulled from FiveThirtyEight’s Democratic primary odds, so that they’ll adjust over time as candidates start to win primaries, and will be updated once after each day a primary occurs. You may note that FiveThirtyEight only has odds for Joe Biden, Bernie Sanders, Elizabeth Warren, Pete Buttigieg, “No One”, and “All Others”. For the candidates we have on our tracker that are not on FiveThirtyEight’s tracker, currently just Amy Klobuchar and Andrew Yang, we are giving them each the odds given to “All Others” (so if “All Others” are at 2%, all three of them in our tracker receive 2%). This slightly inflates the odds of their VPs being picked compared to the odds of the others, considering their low probability, but when combined with the relatively high odds of “No One” winning a majority and a brokered convention, we’re willing to add a bit of additional weight to some far-fetched odds.
So, if for example Biden has a 40% chance of winning the nomination, Sanders has a 20% chance, Warren has a 10% chance, and so on, the VP scores for all possible VPs for Biden will be 40% of their original value, VP scores for Sanders’ VPs will be 20% of their original value, VP scores for Warren’s VP’s will be 10% of their original value, and so on. The ranking here is not in and of itself a probability, it’s more of a “power ranking” of the total potential vice presidents’ scores weighted by the actual odds of a given presidential nominee.
One final note, our public data is available here if you’d like to take a look, and otherwise enjoy the 2020 Vice Presidential Tracker!