Our Full Election Model is Out: What It Says and How We Got Here
We aim to check in on our comprehensive election models for both the presidency and the Senate throughout October, adding factors where needed and shifting the data as new information comes to light. That said, over the course of the last two weeks we’ve added the final states to both models, meaning we now have thorough ratings for every single state and race and a full view of how the election is shaping up. In that vein, I thought it’d be appropriate to take a step back and survey the entire election, talk through some things that stand out, and reflect on the process.
As of the time this publication, the generic ballot is D+1.6.
Survey of the Race
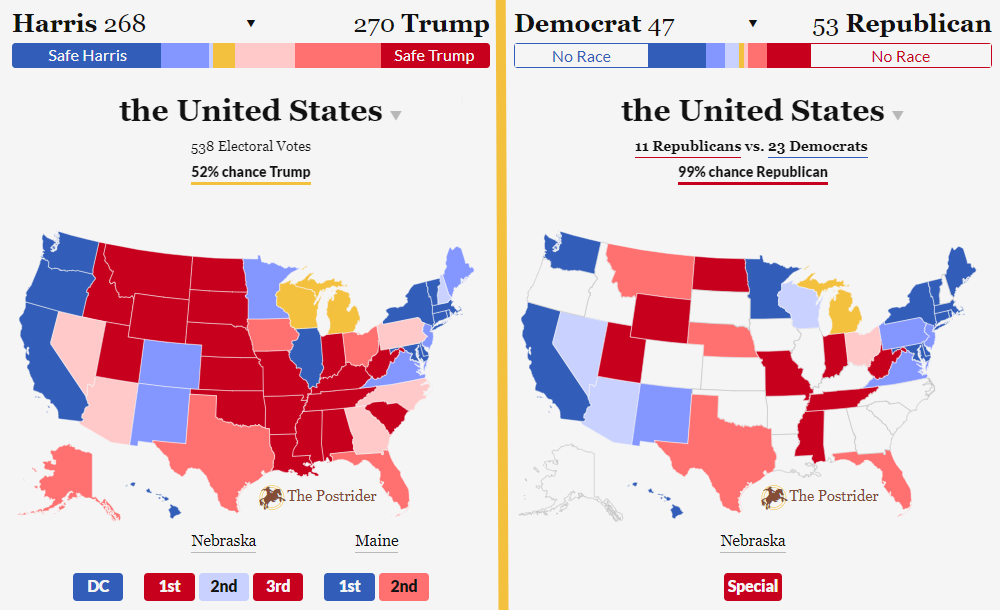
We won’t bury the lede – our model shows the presidential race is almost as close to a mathematical toss-up as possible. Donald Trump has a 52% chance of winning the Electoral College. He is forecast to receive 270 electoral votes. Really, truly, very close!
The model puts Kamala Harris narrowly behind in many swing states (Arizona, Nevada, Pennsylvania, North Carolina, and Georgia) and has her in toss-up range in the remainders (Michigan, Wisconsin), so what gives with the closeness of the race here? A couple things are happening here. For one, Harris has locked down a much higher share of Electoral College votes and her range of outcomes is quite spread out (she has a higher floor and higher ceiling), whereas the possible Donald Trump’s range of possible winning outcomes are a bit more narrow. Would you rather be someone who has a very narrow lead across six swing states but little chance (even with some polling error) to pick up pretty much anything else; or someone who is narrowly behind across many swing states, but with potential pickups in Texas or Florida? Our model suggests it’s about 50/50! A polling error in Democrats’ favor would end up providing Harris with more electoral votes than a Republican-leaning error would give Trump, even if the Electoral College is biased in Trump’s favor to begin with.
As for how the race could improve for Harris, our model currently suggests Michigan, Wisconsin, Georgia, and North Carolina are the lowest hanging fruit. She’d need a clean sweep of all four to win (she could get by with picking up Nevada in lieu of one of these too). Our model is a bit more bearish for her odds in Pennsylvania, Arizona, or Nevada than most, but perhaps more optimistic about North Carolina or Georgia. No matter what, this is all a long way of saying that both candidates have several paths to victory and the race is a toss-up.
As for the Senate, the situation is much more bleak for Democrats. Our model gives Republicans a 99% chance of winning the chamber. Our model favors the GOP far more than others, though it is worth noting that this is a relatively sparse market right now (FiveThirtyEight doesn’t have a Senate model out yet; The Economist just put their model out). There are a couple reasons for this:
- Republicans are essentially guaranteed to pick up a seat in West Virginia this cycle, which would be enough to give them 50 seats, meaning they need to win only: one more seat or the presidential election (as the vice president breaks Senate ties) to take control of the chamber. With the presidential election in toss-up territory, they’re already pretty close to winning the Senate through either scenario, and just one of the many possible races has to cut their way.
- Democrats are defending about eight seats in states that, removing all assumptions, lean Republican (three of which went to Trump in 2020).
- The pick-up opportunities for Democrats aren’t great: the only three really on the radar are deep red Nebraska (where we count the independent candidate for Democrats) and light red Florida and Texas.
- The generic ballot has narrowed – D+1.6 just isn’t the blowout you’d want to see if you’re a Democratic senator in Montana, Wisconsin, or Ohio; these senators relied on national margins closer to D+8 when they held on in 2018. If the generic ballot were closer to D+3 or so, they’d still be clear underdogs, but they’d have around a 10% chance of holding on.
Presently, the Senate model suggests Republicans will hold around 53 seats. As the race heads towards the finish line, there’s room for Democrats to shore up some margins in states like Michigan, Nevada, Wisconsin, and Pennsylvania – but this will only serve to reduce the estimated net gain to the GOP, not majorly affecting Republican’s odds of taking the chamber.
And Some Reflections on Our Process
This has been a laborious process, one that kept throwing hiccups and substantive shake-ups at us. It’s taught us a lot and I like to think we have adapted effectively and quickly, all things considered.
When we first launched the presidential model in April of 2024 (what we’ll call The Postrider Election Model 1.0, or PEM 1.0), we had time on our side and could begin rolling out ratings and building out the story of the election. Of course, Biden dropping out shook that all up, and we had to take a step back as the race settled in for a Trump versus Harris election. This gave us time to work on the Senate model (we refer to them as separate models for simplicity, but they’re actually built as one comprehensive model) and we ultimately got both models back up around five weeks ago, set for the roll-out of 32 long-form analysis articles: 21 for the presidential ratings and 11 for the Senate.
At some point in mid-September, as the race narrowed and we were wrapping up filling out all of the ratings, it became clear there were some places the existing model was failing us. This caused a couple weeks of head-scratching and research, some big conversations, and some creative solutions. It was after that process that The Postrider Election Model 1.1 (PEM 1.1), the version now running, was rolled out. As we explained in a complementary piece, this involved some more impressive statistics (if you consider normal distributions “impressive”) to ascertain probabilities for individual states, and another layer of code and probabilistic determination to derive a national rating for both the presidency and the Senate. This elevated our model dramatically, fixed some of the things that made less sense in an apparently close race like the one we have this year, and provided some additional rigor to what is an entirely homebaked project.
I have some ideas for how to improve the model further – PEM 1.2, if you will – but it won’t happen this cycle. Adjusting for correlation (wherein certain factor shifts in certain similar states will proportionately shift others) and for elasticity (the strength of a state’s response to the generic ballot shift) are top of mind, but these are things we have two years to work on. And once the election is over, we’ll definitely want to build on the lessons of this cycle – what we got wrong and right, and where we can always continue to approve.
We’ll check in again shortly, but for now, we’re just thrilled to have our full model and ratings up and ready for the march towards Election Day. As always, let us know if you have any questions and keep an eye on that generic ballot… if it sticks around D+2, this could be very, very close.