
When Will the Rust Belt’s Electoral Supremacy End?
Recently, we dove into something of a political obsession of ours: the “crossover” between the Rust Belt and the Sun Belt – and tried to figure out at what point Democrats would have an easier time winning the Sun Belt than they do the Rust Belt.
As we noted in that piece, the Rust Belt has proved the decisive region in recent presidential elections because the state margins are so close, meaning they are simply the states requiring the least work to “reach” at least a plurality of the vote (all else equal, you’d expect a Democratic candidate to carry a state which usually leans Republican by 1% before they carry a state which usually leans Republican by 6%, for example).
But, lamenting this stalemate and perennial electoral power of the Rust Belt region, we identified – as we have for years – that the region was consistently becoming harder and harder for Democrats to win while, at the same time, the Sun Belt was moving into play for Democrats. There’s a lot of evidence to support this trend. We won’t rehash it here since we spent a total of six articles exploring it a couple years ago, and there are some potential (yet unproven) variables which might slow or even reverse the trend (such as the migration of conservative voters out of the Midwest and to states like Florida, or a disproportionate number of COVID related deaths among Republican voters). But, given what we do know – such as the margins in states across the last few presidential elections, the strength of the correlation in how they’ve shifted, and where the states were relative to the nation in the last election – we can assess when the crossover might occur and whether or not it has already happened.
Then, we tried to determine what the “lowest hanging fruit” for Biden was in terms of 2024, and ultimately concluded that there is no clear path to an electoral college victory without several Rust Belt states. By and large, they are all becoming more Republican, but, at least for now, they remain attainable for Democrats, and winning a state like Michigan likely remains easier than winning Georgia or North Carolina for the Biden campaign. In other words, the Rust Belt/Sun Belt crossover has yet to come.
If Not Now, Then When?
In that spirit, we return with a sequel, asking – if not in 2024, then when and how would the crossover occur?
We’ll stipulate with some constraints: going forward, we will only consider nine “crossover” states: Minnesota, Michigan, Pennsylvania, and Wisconsin in the Rust Belt; and Arizona, Georgia, Nevada, North Carolina, and Texas in the Sun Belt.
In terms of each state’s starting point, we’ll keep to the pick-your-own adventure option: you can work from the 2020 election result (how many points to the left or right of the national popular vote a state was), but we’re pretty partial to using FiveThirtyEight’s partisan lean (which incorporates data from a couple more elections at varying weights). We’ll analyze the crossover based on both values for each of these states and additionally make one based on an average of these two values.
Finally, we will need to continue to apply trendline data forward; we’ll do this similar to how our 2024 presidential election model works – by multiplying the average yearly shift of a state (based on a regression considering the last six presidential elections) by the R² (indicating the strength of the relationship between time and shift of a state) for that state. If we multiply this value by four and add it to whatever baseline we’re using, we’ll get the estimated 2024 lean. Multiply it by eight, we’ll get 2028; 12, 2032; and so on. To be sure, the uncertainty increases as we extrapolate based on a trendline gleaned from the last six elections and apply it to an election three, four, or five cycles away from now; but the average is at least a well-reasoned conclusion.
As it stands, absent our nine crossover states, Democrats have 216 electoral votes and Republicans have 179. We noted that, in 2024, Biden’s path to victory based on this extrapolation of trendline data alone required him to win a national popular vote margin of about 4.1%. This is a little below what he achieved in 2020, but would still be considered a sizable overperformance. Nonetheless, there is a significant bias in favor of Republicans necessary to overcome to win the 270th, and therefore decisive, electoral vote. The Crossover is not in play for 2024, but it might be in the next election, so let’s look ahead.
2028: An Easier Path, but Still Reliant on the Rust Belt
Jump forward four years to 2028 and it’s easier to see which states will stagnate and which continue to shift. Agnostic of the popular vote result, we would expect the state margins to look like this in 2028 (leading party indicated by the color; italicized state indicates likely tipping point state which delivers the 270th electoral vote):
| State | Electoral Votes | 2020 Election Baseline | Partisan Lean Baseline | Average Baseline |
| Minnesota | 10 | 2.6% | 1.9% | 2.3% |
| Nevada | 6 | 2.1% | 2.6% | 2.3% |
| North Carolina | 16 | 3.5% | 2.5% | 3% |
| Georgia | 16 | 1.6% | 4.7% | 3.1% |
| Michigan | 15 | 3.3% | 2.9% | 3.1% |
| Wisconsin | 10 | 4.4% | 4.4% | 4.4% |
| Arizona | 11 | 4% | 7.1% | 5.6% |
| Pennsylvania | 19 | 6.2% | 5.9% | 6.1% |
| Texas | 40 | 6% | 8.8% | 7.4% |
To be sure, this still suggests a map that favors Republicans, so much so that the Democratic candidate would still lose every crossover state other than Minnesota given a popular vote tie. That said, there is some movement, so the 2028 path for a Democrat probably looks like this:
- Win Minnesota. This remains very doable!
- Win Nevada. This is actually not strictly necessary in a couple outcomes here because it only has six electoral votes, but it’s hard to see a path forward where Nevada hasn’t been picked up on the way.
- Win North Carolina, Georgia, and Michigan. A Democrat achieving a respectable 3.1% of the popular vote would accomplish this; the tipping point state – probably Michigan – would be 3.1% to the right of the nation in this case. This is better than the electoral college bias in 2020 or what it looks like it may be in 2024, but still requires the Democrat to do a little bit better than average.
Though the path here is easier, in that the Democratic nominee doesn’t need to overperform to the same degree as they would in 2020 or 2024, states like Wisconsin and Pennsylvania will be increasingly out of reach based on this extrapolation. Minnesota and Nevada are stuck in limbo, barely budging one way or another. Even in this scenario, Michigan probably remains a must win, but it’s the only must-win in the Rust Belt. So, yes, technically, that one part of the Rust Belt remains the lowest hanging fruit for Democrats, but the path away from that region determining the outcome is in spitting distance.
2032: Does the Path Seriously Get Harder Again?
Another four years forward and we need to address a new wrinkle. For simplicity’s sake, we will assume no states lose or gain electoral votes as a result of reallocation due to the 2030 census (in reality, this will likely reduce electoral votes in the Midwest and increase electoral votes in the Sun Belt; in an effort to be conservative and to save time, we won’t make this assumption here).
| State | Electoral Votes | 2020 Election Baseline | Partisan Lean Baseline | Average Baseline |
| Minnesota | 10 | 2.6% | 1.8% | 2.3% |
| North Carolina | 16 | 2.3% | 1.3% | 1.8% |
| Georgia | 16 | 0.2% | 3.4% | 1.8% |
| Nevada | 6 | 2.1% | 2.6% | 2.3% |
| Michigan | 15 | 4.2% | 3.7% | 3.9% |
| Wisconsin | 10 | 4.7% | 4.7% | 4.7% |
| Texas | 40 | 3.9% | 6.8% | 5.4% |
| Arizona | 11 | 4% | 7% | 5.5% |
| Pennsylvania | 19 | 7.7% | 7.4% | 7.5% |
The 2032 Democratic presidential nominee can win in this map by:
- Continuing to carry Minnesota. Easy enough.
- Winning North Carolina, Georgia, and Nevada. An average performance by a Democrat in the popular vote will handily accomplish this. Nevada is not really necessary again, but would likely get swept up on the way (and, depending on how many electoral votes the Midwest has lost or states like Texas or Florida have gained, could still be relevant).
- Win Michigan. Except now Michigan, likely again the tipping point state, will be nearly 4% to the right of the nation, necessitating a Biden-in-2020 style overperformance.
This approach remains difficult, but depending on which baseline you look at, it may not be totally necessary: Texas and Arizona are more “in play” if you go off of 2020 numbers and extrapolate forward rather than the comprehensive partisan lean. That said, on average, Michigan still appears to be the most obvious candidate for the pivotal 270th electoral vote, even as it continues to move further and further out of reach for Democrats. The 2032 trendline could very clearly hand a Democrat the presidency without a single Rust Belt state, but it’s hard to imagine a Democrat would not campaign as equally in Michigan as they would in Arizona at this stage, so it’s hard to definitively declare the Rust Belt’s reign as kingmaker over.
2036: Rust Belt Supremacy Ends
Could 2036 really be the year? Let’s take a look:
| State | Electoral Votes | 2020 Election Baseline | Partisan Lean Baseline | Average Baseline |
| Minnesota | 10 | 2.6% | 1.8% | 2.3% |
| Georgia | 16 | 1.1% | 2.1% | 0.5% |
| North Carolina | 16 | 1.1% | 0.1% | 0.6% |
| Nevada | 6 | 2.1% | 2.6% | 2.3% |
| Texas | 40 | 1.9% | 4.7% | 3.3% |
| Michigan | 15 | 5% | 4.5% | 4.8% |
| Arizona | 11 | 3.9% | 7% | 5.5% |
| Wisconsin | 10 | 5% | 4.9% | 5% |
| Pennsylvania | 19 | 9.1% | 8.8% | 9% |
What does the Democrat have to do here?
- Once again, win Minnesota. Still easy enough.
- Win any one of Georgia, North Carolina, or Nevada. It doesn’t matter which, they’re all pretty achievable given an average popular vote margin; anyway, a Democrat would probably win all three on their way to…
- Pick off Texas. It’s not even that hard! A popular vote victory akin to Obama’s 2012 victory of about 3.8% should do it, making Texas the tipping point state.
At this point, the Democrat would have 304 electoral votes (assuming they’ve carried all states easier to get than Texas), and have no need to win Michigan, Pennsylvania, or Wisconsin. In fact, the Democrat could afford to lose Minnesota; or, to really underscore my point could even concede Illinois and still take the White House. The era of Rust Belt supremacy comes to an end.
2040: Tipping-Point Texas
Still, let’s run this forward one final time and really push out where this goes:
| State | Electoral Votes | 2020 Election Baseline | Partisan Lean Baseline | Average Baseline |
| Minnesota | 10 | 2.6% | 1.7% | 2.3% |
| Georgia | 16 | 2.4% | 0.7% | 0.8% |
| North Carolina | 16 | 0% | 1% | 0.5% |
| Texas | 40 | 0.1% | 2.7% | 1.3% |
| Nevada | 6 | 2% | 2.6% | 2.3% |
| Wisconsin | 10 | 5.3% | 5.2% | 5.2% |
| Arizona | 11 | 3.9% | 6.9% | 5.4% |
| Michigan | 15 | 5.9% | 5.4% | 5.6% |
| Pennsylvania | 19 | 10.6% | 10.3% | 10.4% |
Though this doesn’t meaningfully change the approach (the approach being: win Texas at all costs and hold Georgia or North Carolina while you do it), it does epitomize the new political, economic, and cultural power center in America: the Lone Star State.
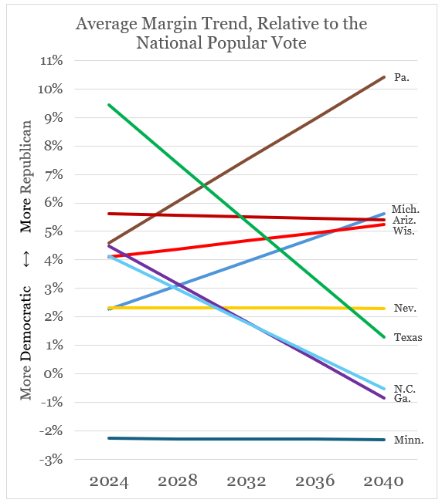
By the mid-21st century, Texas will likely be the largest state by population, and it appears to be on a path to match this growth with newfound political relevance. That it is poised to become the must-win tipping point state in the next two decades, should current trends continue, signals a remarkable shift for what has been for many decades something of a spiritual home for conservatism. That it is the state most likely to dethrone nearly a half century of Rust Belt control over electoral outcomes is a fitting testament to America’s shifting coalitions and the crosscurrents of modern electoral strategy.