The Postrider’s 2020 Presidential Ratings
Can you believe general election season is just getting started? Yes, with the conclusion of the Democratic and Republican national conventions in August, we’re officially off to the races! Call this election whatever you want: the “most important election in the history of our country”? Why not. A “battle for the soul of this nation”? It sure seems that way! The coronavirus election, a referendum on the president, the “George Floyd election”, or a skirmish in the incessant culture war; let’s just go with all of the above. No matter how you see it or how you come down, we hope you’re as excited as we are, because 2020 is the first year The Postrider will have the privilege to unveil our own ratings for a presidential election, providing background as we keep an unwavering eye on an election that may go long past Election Day.
You may recall our 2018 Senate race ratings and analysis, which served as a predecessor and dry run for the big showdown this year. We are planning to unveil our 2020 Senate ratings in the coming weeks as well, which will come later because some states hold late Senate primaries (Delaware’s primary isn’t until September 15, less than 50 days from Election Day!), but our presidency ratings will be different from those as well: broader, bigger, and less personal. So, here are some key things to keep in mind about our process this cycle:
Ratings-Focused
In our 2018 Senate ratings, we focused on telling the individual stories behind the candidates — because candidates matter more in localized races, and less so on the presidential level — and every state’s Senate race is different, with different personalities and dynamics. The presidential election is, by definition, nationalized and consistent. It’s the same two candidates across every state, so that kind of candidate-focused narrative is less useful. That’s why we’re choosing to focus on ratings instead of that individual analysis.
Each state will be rated on a scale as follows:
| The candidate has over a 99% likelihood of winning the state. This is an all but assured state for that candidate, but be mindful that if you were to run the election hundreds of times, thus with hundreds of “Safe” states, you’d expect less than one out of 100 to flip; that’s very low and very rare, but it does happen. Nonetheless, “Safe” means we are confident in a candidate’s odds in a given safe state. | |
| The candidate has at least an 85% certainty of winning the state, so the other candidate has at least an outside chance of winning the state in 1% to 15% of cases. In our map, we have around ten “Likely” states, so if one of them flips; that would not be surprising. It would also not be totally crazy if none of them flip, though the more there are, the more you should expect one to flip. | |
| The candidate is slightly favored but is by no means safe; the other candidate has somewhere between a 15% and 40% chance of winning the state too. In our map, we have just under ten of these states, so it should actually be surprising if at least one of these states does not flip. | |
| The race in this state does not clearly favor either candidate over the other. Each candidate has between a 40% and 60% chance of winning the state. |
We determine ratings based on polling data, demographic data, news events, historical trends, the electoral environment in similar states,Some states are highly correlated, like the midwestern states of Michigan, Pennsylvania, Wisconsin, Ohio, and Minnesota. If things take a dramatic turn in Wisconsin, you’d expect similar movements across these states based on their similar demographics, political histories, urbanization, population size, economic similarities, etc. Note that geography is not always the best determinator for these variables; for instance, Washington state and Colorado are also similar; as are Maine and Montana. how states are responding to COVID-19 and planning their election procedures, and all sorts of other smaller variables. It’s slightly more scientific than a “gut instinct” but less so than an explicit statistical model. We’re aiming for something closer to the Cook Political Report, Sabato’s Crystal Ball, or Inside Elections,Inside Elections’ publisher is also employed by this author’s employer and The Postrider is completely independent. I mention this for full disclosure, Washington is a small town. with the intent to handicap the race, more so than our idols at FiveThirtyEight, though our various ratings are generally similar other than at the margins. All of our ratings are approved and determined by both the Editor-in-Chief, Michael Lovito, and yours truly, the State & Science Editor.
Update-Oriented
If we decide a state rating merits adjustment, we will publish that under the hover-over for a given state, and write a larger article if necessary. For example, at the time of publication, we have Colorado rated as “Likely Biden”, but if a few weeks from now Trump has improved his numbers dramatically amongst white college-educated voters and Latinos, we’d be inclined to revise our rating in Colorado (which has large shares of both kinds voters) down to “Lean Biden”. We will provide a ratings’ history when you hover over any given state which will include the date of the ratings revision(s) and an explanatory note or link to a larger piece justifying the change. This will make interacting with our ratings map a little more interesting, involved, and useful to watch as the race goes on and provide more context where necessary.And give us a better starting point when we work on our 2024 ratings for the next cycle!
All ratings revisions will be approved by both of the editors on this project, and based on the same criterion noted above in terms of changes in polling, how the candidates are doing amongst certain demographics, state-by-state correlations, etc. We won’t change ratings if we believe they are likely to change by Election Day, since that would defeat the purpose of forward-rating these races, but we will change as often as we need to if compelling evidence points to better or worse prospects for the candidates in a given state.
The Overall Projection
Our projection of the total electoral votes per candidate is not a prediction, it is a mathematical allocation based on the candidate’s odds for given electoral votes. For example, we have Tennessee as “Safe Trump” , and with 11 electoral votes, we multiply 11 by 0.99 (as “Safe” we’ve determined means it’s at least better than 99/100 odds that Trump wins that state), or 10.89 votes and 0.11 for Biden. Meanwhile we’ve rated Virginia as “Likely Biden”, so we multiply its 13 electoral votes by 0.85 giving us 11.05 votes for Biden and 1.95 for Trump. “Lean” is multiplied by 0.6 and “Toss-Up” by 0.5. Once all states’ electoral votes have been split in this way, we round down to the nearest electoral vote.
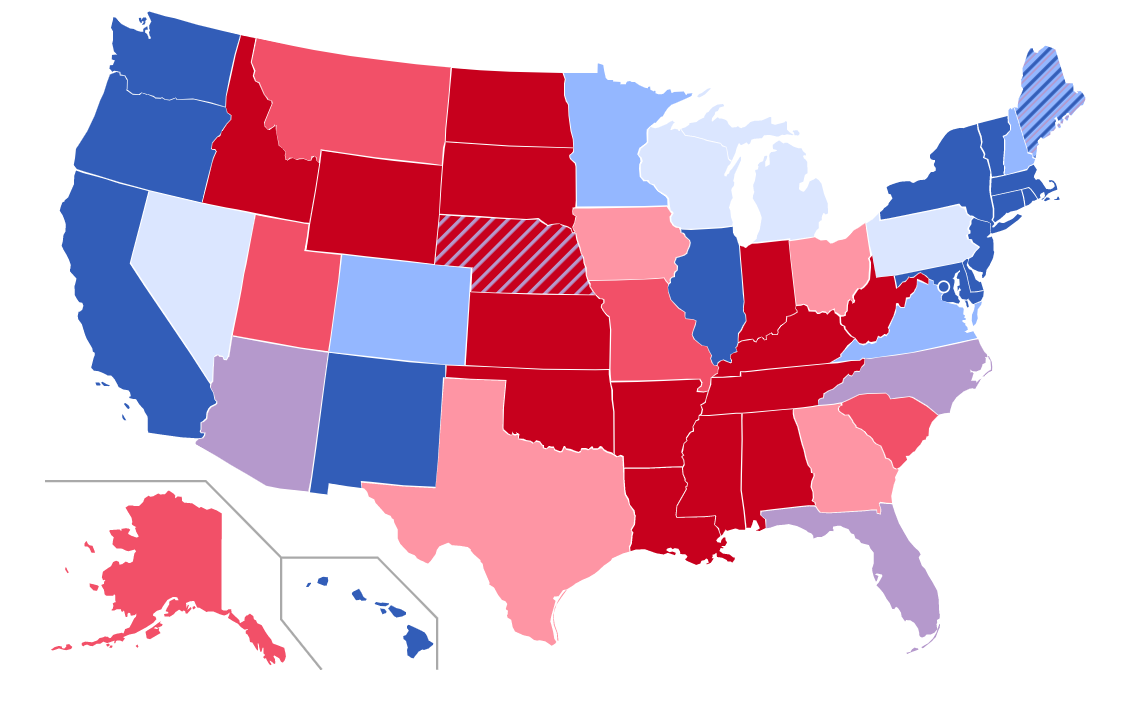
Maine and Nebraska split their electoral votes by congressional district, so we’ve accordingly rated the state at large (two electoral votes) and each of their congressional districts and applied those ratings to their individual and statewide votes. These states are shaded to reflect the diaspora of ratings at large and for the individual districts.
At the time of publication, our projection has Biden at 315 electoral votes, 45 more than the 270th vote he needs to win, and a slightly more conservative estimate than FiveThirtyEight’s or The Economist’s forecast models.
Remember that we’re not making predictions, we’re just providing an educated assessment on the state of the race in every state.And the District of Columbia! So don’t write us a mean note after Election Day saying “you had Wisconsin as ‘Lean Biden’ but then Trump won it by one percent, idiot!” No, we didn’t predict that Wisconsin will “only” go for Biden by a little, we’re merely stating it’s more likely than not to go for Biden, but Trump still absolutely has a shot there.
With all of this in mind, The Postrider is proud to present its ratings for the 2020 presidential election.