
How Our (Emergency) 2024 Democratic Vice Presidential Power Index Works
We’re about 100 days out from a presidential election, and the Democrats have to build almost an entirely new ticket from scratch. We didn’t think we’d be here either, but luckily we’re never ones to shy away from discussion of composing a presidential ticket, so we know just how to help.
In 2020, we developed a tool called the “Vice Presidential Tracker.” With an extensive methodology, lots of data, and some serious grit, we built out a model that would determine the strength of any presidential ticket based on a given top-of-the-ticket nominee. By running data on an array of potential vice presidential picks through a model that also considers data pertinent to the presidential nominee, we can determine the relative strength of a given ticket overall and make a statistical case for who a given nominee should select as their running mate. Though this tool is not predictive in nature, it identified then-California Senator Kamala Harris as the strongest possible running mate for the ultimate Democratic nominee, Joe Biden. Biden, of course, did end up selecting Harris as his running mate.
Almost four years later, we built out a model adjusted for the 2024 Republican ticket. Because of the more homogenous makeup of the Republican base and electorate, we tinkered with the model slightly, but it’s largely built on the same careful research and statistical extrapolation. Did Donald Trump take our advice? Not at all – he opted for one of the historically weakest tickets he could have built, but you can’t say we didn’t try to offer him our earnest advice.
So we figured that was that, we can barrel right ahead to the presidential election and spend our efforts on the forthcoming Trump versus Biden showdown.
Fate had other plans, so after some last minute programming and touching up, we’re rolling out an updated, unexpected Democratic Vice Presidential Power Index now as well! Who should Kamala Harris’ running mate be? Click on over to the tool, or read through our methodology, to find out.
Methodology
Candidate Inclusion
In the interest of expediency and rolling this thing out quickly, at launch only Vice President Kamala Harris is included as a top of the ticket option. If more serious candidates actually enter the race, we’ll adapt, so stay tuned.
VP Inclusion
Potential vice presidential choices are included if… you want them to be! So long as they are eligible to be vice president (they have not served more than six years as president, they are at least 35 years old, are a natural born American citizen, and must have lived in the United States for 14 years), they can be added to the Power Index. Our Editor-in-Chief and I put together a list of around 20 names who we thought were particularly likely to be on a long list for Harris. If you’d like us to add someone to the VP Power Index, shoot us a note at at contact@thepostrider.com and we’d be happy to oblige!
VP Score
On to the nitty gritty, here’s how an individual potential VP score is determined. It starts with the nominee, and takes into consideration their:
- State of residence
- Gender
- Race (this is a binary, a score of “0” if they are caucasian; a score of “1” if they are any other race including Latino)
- Years of federal government experience (ex. as a congressman, senator, cabinet secretary, vice president, high level military command, etc.)
- Years of non-federal government experience (ex. as a governor, state representative, general military service, etc.)
Taking that data for a given nominee, it runs through every single potential VP choice, for whom the data is their:
- State
- State’s number of electoral votes
- State margin, or the partisan lean of their state plus the generic ballot (positive number is leaning Republican, negative number is leaning Democrat; this is taken from FiveThirtyEight’s open source partisan lean data. The generic ballot lean (also courtesy of FiveThirtyEight), which is the degree that national headwinds favor Republicans in general is then added to this, So, for example, if the state has a lean of -2 (2 points more Democratic) and the generic ballot has a lean of 5 (5 points towards the Republicans), then the state margin is 3. Because we’re late in the game and have more data, we’ve also added the four-year shift data of a state’s partisan lean from our work on our presidential model which roughly estimates how the state has moved from its 2020 position based on its historical movement (and consistency thereof) towards or away from a particular party. You can read more about that calculation here.
- Gender
- Race (this is a binary, a score of “0” if they are caucasian; a score of “1” if they are any other race including Latino)
- Reelection year (If they are currently in office, this is the next year you are up for election. if they are not currently in office, or if their state allows you to run for two offices at once, this number will be “0”)
- Years of federal government experience (ex. as a congressman, senator, cabinet secretary, vice president, high level military command, etc. Note that if they are currently in office this will include all of 2024 as a year, so a representative first elected in 2016 that took office in 2017 and would presumably serve until January of 2025 will have 8 years)
- Years of non-federal government experience (ex. as a governor, state representative, general military service, etc.). Combining years of federal experience with years of non-federal experience results in total experience.
- Minimum viable office (this is a binary, a score of “0” if they do not meet the “minimum viable office” standard of more than 6 years as a member of the House, any service as a Senator, cabinet member, or military command, or as a governor, a score of “1” if they do)
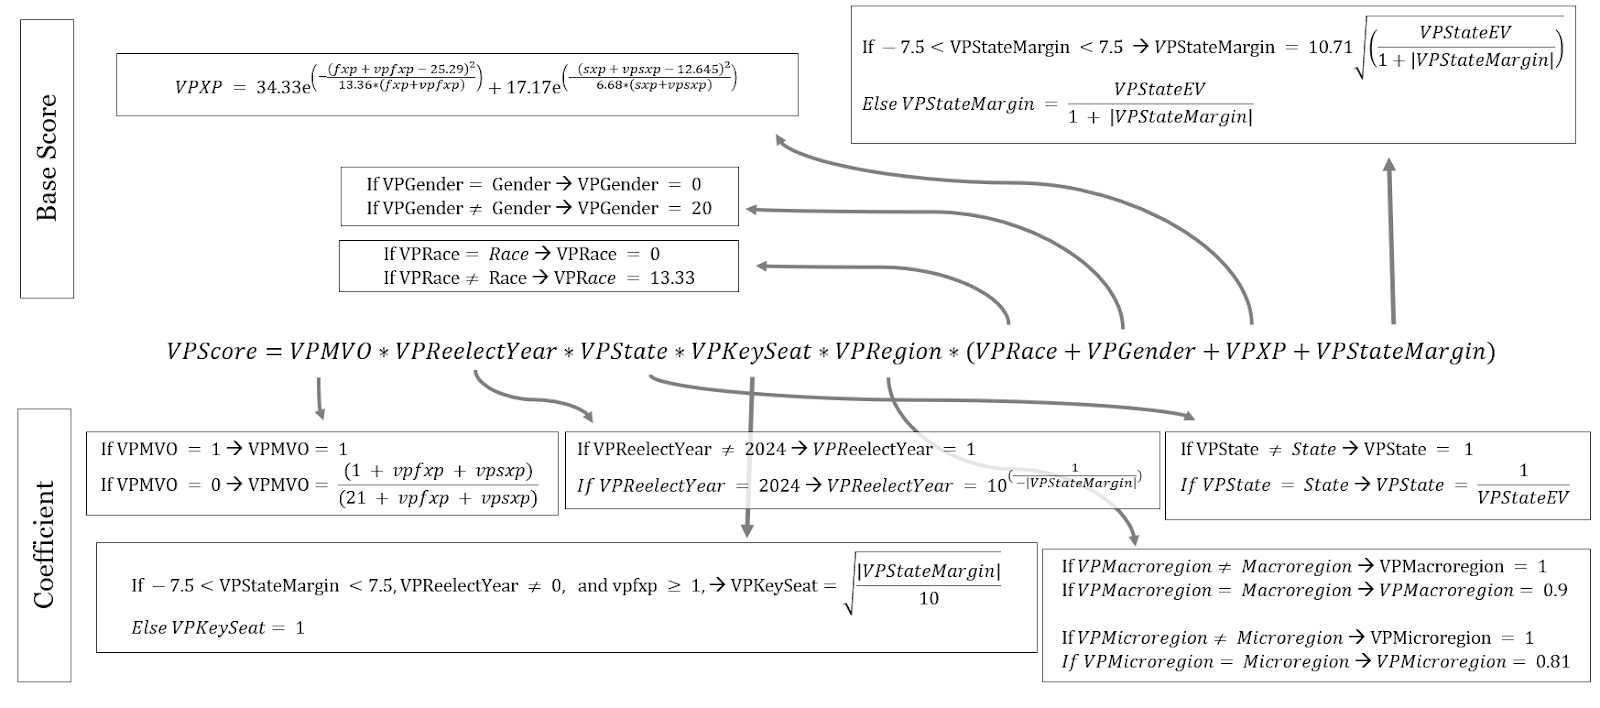
Taking all of these variables into account, the model will run all of the possible vice presidential picks for a given nominee, and determine a “VP Score”, which is the strength of the ticket based on an equation that is easiest to describe by breaking it down into two key parts: the “coefficient” and the “base score.” The coefficient is the values multiplied together which serve to lower an overall score; the base score provides increases. The base score multiplied by the coefficient gives the final score. Here’s some more detail on each:
The Coefficient
The coefficient has five components all multiplied together. These are identical to the 2024 Republican model, which is itself just updated for one more cycle’s worth of data from the 2020 Democratic model.
VPMVO: This is the minimum viable office adjuster. If a VP choice meets the standard, it receives a value of “1” (because this leaves the core score unaffected, this will be the case with all of the variables in the coefficient). If they do not, this value is calculated as (1 + total years of experience) / (21 + total years of experience). This 1/21 base value was selected because out of the 21 vice presidential picks (excluding incumbent vice presidents) since 1968, only one (Geraldine Ferraro, Walter Mondale’s pick in 1984) did not meet this qualification. Note that for this, we are including the Trump-Vance datapoint since we have it. We use 1968 as the base year throughout this project because it represents the fundamental turning point in how American presidential primaries are carried out in modern times and it lets us start with no incumbent president running at the top of the ticket. Because total experience is added on to the numerator and the denominator, this number can reasonably increase if there is enough lower-level experience, but always remains a detractor.
VPReelectYear: If a potential VP is not up for reelection in 2024, choosing not to run for reelection, or they can run for two offices at once, this has a value of “1”. However, if those do not apply and they’re up for reelection in 2024, then this is calculated as 10 to the power of one over negative the absolute value of the generic ballot score. So if the generic ballot is closer, it becomes far less wise to put the candidate on the ticket at the risk of losing their seat (keep in mind, if the generic ballot is closer, they’re also far less likely to win the presidential election as well). However, if the generic ballot is looking like a blowout, this number approaches 1.
VPState: This one seems redundant, but essentially it boils down to this: your vice presidential pick should not be from the same state you are. Pragmatically this is because the state of the pick does have a small impact and it makes sense to diversify your ticket, and electorally because electors from one state are forbidden from voting for two candidates from the same state on their ballot. You’d be forfeiting a given number of electoral votes, possibly ending up with a situation where a president or vice president were elected without the other.If you love political hypotheticals, this almost happened in the year 2000. Both George W. Bush and Dick Cheney were registered in Texas, but Cheney changed his registration to Wyoming before the election. The electoral vote was close enough where this would have deprived Cheney the vice presidency (at least initially) and required the Senate to choose a vice president. If you’re from different states, you get a value of “1” again; if you’re from the same state, then this number will be one over the electoral votes of the VP pick’s state. I do this because it still cuts the score by a lot (the minimum electoral votes a state can have is 3, which still brings it to a total score reduction of two-thirds) but not all states are created equal and technically, having two candidates from California (54 electoral votes) or Texas (40 electoral votes, see footnote above) would be immensely stupid, whereas having two candidates from tiny Rhode Island (4 electoral votes) would be… still pretty stupid, but less so.
VPKeySeat: This attempts to address the strategy in deliberately not picking an otherwise near perfect vice presidential candidate. The logic here is presidential candidates will avoid picking a running mate who would cost them a key Senate seat they are at risk of losing in the future.
Here’s how this works. If a VP choice’s federal experience is at least one, their reelect year is not “0” (this means that they are not running for reelection at all), and their state margin (remember this is the partisan lean plus the generic ballot) is between -7.5 and 7.5 (any race that is within this margin would make it at least somewhat competitive), then this is calculated as the square root of the absolute value of the VP state margin over 10. This allows a great pick to be exponentially weaker if their state’s margin is too close, but doesn’t hurt them too drastically if their state’s margin is safer, while still providing a slight disadvantage in picking them. If this situation does not apply, the score is, once again, a simple “1.” In the instant model, this disadvantages someone like Arizona Senator Mark Kelly: a potentially great pick for Harris, but a valuable Senate seat that is vulnerable without him.
VPRegion: Regional balancing is something most presidential campaigns strive for so that they can claim to be representative of the nation as a whole instead of one particular region. This has been newly updated to reflect two levels of balance. First, by assessing macroregions (U.S. Census Regions except for DC, Maryland, and Delaware are moved into the Northeast). Only four times since 1968 have new tickets been from the same macroregion. Then, we go one further level down to consider a microregion, using the U.S. Bureau of Economic Analysis’ regions, since they are representative of the more specific economically, politically, and culturally similar areas of the country, but remain large enough to divide the nation in eight different slices. Using the BEA regions, there have only been two times since 1968 where the president and new vice presidential pick (incumbent tickets are excluded) are from the same region. Conventional wisdom favors regional diversity, both generally and especially amongst small groups of neighboring states, so if the macroregions are not shared, the value here will be “1,” and if the macroregions are shared, it is reduced to 0.9. Then, if the microregions are not shared, the value remains 1. If they are shared, it falls to 0.81. This is because it’s historically twice less likely that the microregions are shared than macroregions, and only 10% of tickets have ever shared a microregion (so, essentially, these probabilities are inverted – a ticket is dinged slightly more for sharing a microregion than a macroregion). This means if a ticket shares both a macroregion and a microregion, the regional value overall becomes about 0.73 – not the end of the world, but a substantial obstacle to overcome.Technically, based on the regional determinations we’re using, both could be true, or just one. For example, on a ticket with a candidate from Arizona and one from Texas, the macroregional hit wouldn’t impact the ticket (Arizona is in the “West” and Texas is in the “South”), but the microregional hit would (both are in the BEA’s “Southwest”).
Multiply all of these coefficient components together and you’ll get the coefficient half of the equation to determine the VP Score.
The Base Score
The “Base Score” is where you can find the key difference between the factors which go into this Power Index and the one we produced for the Republicans. It’s no surprise that the constituencies, influences, and interest groups in the Democratic Party are distinct from those in the Republican Party. In 2020, we built our model from scratch using conventional wisdom, academic material, and statistics derived from some unique sources to answer the somewhat icky questions of how much value to give a diverse presidential ticket considering race, gender, and age. We adjusted our Republican model to account for some differences in the party’s coalitions, but will be going back to the 2020 Democratic model’s assumptions, and improving on them, for the 2024 Democratic model.
The base score for the Democratic Vice Presidential Power Index has four key components all added together; they constitute the core score that is then reduced by the coefficient. In theory, a perfect candidate would have a base score of 100: 51.5% based on complementary experience (which is a major consideration in selecting a running mate), 30.3% based on the competitiveness and importance of the VP pick’s state (which can help, but doesn’t often make a major difference), 12.1% based on gender diversity, and 6.1% based on racial diversity. I’ll explain more why these are allocated as such in the individual descriptions.
VPRace and VPGender: If the nominee and the VP choice have the same race value (remember, this is binary), VPRace receives an input of 0. If they are different, it receives an input of 6.1. If the nominee and the VP choice have the same gender value, VPGender receives an input of 0. If they are different, it receives an input of 12.1.
I’ll be candid – the need for racial and gender balancing on the ticket is relatively new, so there’s not enough data to make much more than an educated guess as to how much it will matter. My inclination is that race matters about two-thirds as much as gender, because they obviously overlap with each other (there are more women in the country than there are white women in the country). This is imperfect statistical logic and is largely based on our 2020 model for the Democratic Party’s vice presidential selection. In 2020, we surmised there would be immense pressure placed on the modern Democratic Party to have a diverse ticket, and it is common sense that – all else being equal – a ticket with two white men on it is weaker and more alienating. We reached a 20 point value here back in 2020 as this came from the regression coefficient from betting data indicating that if the presidential nominee was not a woman, there was approximately 20% more chance that the vice presidential nominee would be a woman. We applied the same logic for the 2024 Republican model as well. However, now we have a much better proxy – historical data. We know that of 21 unique presidential tickets, there have been four which are gender diverse, and two which are racially diverse (these are, of course, not mutually exclusive, the Biden-Harris 2020 ticket was both). We have to weigh these proportionate to the number of tickets that weight other factors more, which is how we resolve them down to the 12.1% and 6.1% weights, but these are now proportionate to each other and anything else which can “strengthen” a ticket based on historical assessment. The ticket is certainly stronger by virtue of it not being topped by two white men, but we don’t want to overstate this importance and tokenize a ticket either. This provides that balance.
VPXP: Arguably the most complicated and by far the most important measure that increases a ticket’s strength, this composes up to 51.5% of the base score. This is because 80.95% of tickets fell within one standard deviation of the average federal experience level, so we weigh this proportionate to the number of tickets which are gender or racially diverse or prioritize a swing state. By looking at every unique vice presidential pick from 1968 and the combined federal experience with the presidential pick (in years) and how many times the VP pick was from a competitive state,We’re using the same standard as this NPR article, which describes a swing state as any state that had a margin of <5% between the two candidates in any two of the four elections chronologically closest (before or after) a particular election year, as well as the election itself. Mike Pence (Indiana), for example, is not a swing state pick, even though there was one election (2008) in which it was won by a margin of less than five percent. we note that the VP pick was from a competitive state ten times out of 21 unique picks (47.6% of the time) and the combined federal experience averaged 25.29. I ran descriptive statistics on the combined federal experience in years to find a standard deviation of 13.36, and went one standard deviation on either side of the mean to find an acceptable level of combined federal experience (that would, under the empirical rule, capture about 68% of all presidential tickets). There are 17 out of 21 unique presidential tickets with a combined federal experience within one standard deviation from the mean. This implies that experience is about 1.7 times more important in picking a VP than picking one from a competitive state (or about 4.26 or 8.4 times more important than picking a gender or racially diverse ticket, respectively). In order to weight out all these variables, we require a weight of 51.5% for complementary experience.
VPXP is calculated in two parts, using the presidential and vice presidential candidates’ combined federal experience and their combined non-federal experience. Recall the average combined federal experience is 25.29 years, and the standard deviation for that was 13.36, meaning that under the empirical rule, 68% of values must lie within one standard deviation of the mean. The reason it is not just simply one standard deviation below the mean (and continuing to increase the score the more combined years the ticket has) is because there appears to be diminishing marginal returns in having a ticket with too much experience. Otherwise, most presidential tickets would have combined federal experiences well into the 40s or 50s. The experience, instead, more closely follows a normal distribution, where there is an increasing benefit up to a point, and then a decreasing benefit. This is also a good proxy for age, as two candidates on the ticket with 40 years of federal experience each would constitute an unusually elderly ticket, something that has received a lot of attention and criticism in recent elections.
The formula for determining the experience score is composed of two parts: combined federal government experience and combined non-federal government experience. Federal experience is weighted twice as much as non-federal experience (meaning it is weighted by 27.98 compared to non-federal experience’s weight of 17.17, so that a perfect score in both would result in the 34.33 that the total VPXP value is worth in the base score). The formula for both comes out to:

Where e is the mathematical constant multiplied by 34.33 in the first half for the federal experience weight; and by 17.17 for the non-federal experience weight, and federal experience is taken to the power of the candidate’s federal experience (fxp) plus vice presidential candidate’s federal experience (vpfxp) minus the mean squared, over the standard deviation times the sum of the candidate’s federal experience and the vice presidential candidate’s federal experience, all multiplied by negative one. Non-federal experience is to the power of the candidate’s non-federal experience (sxp) plus vice presidential candidate’s non-federal experience (vpsxp) minus half the federal mean (as we’re weighing it by half) squared, over half the federal standard deviation (once again, because we’re weighing it by half) times the sum of the candidate’s non-federal experience and the vice presidential candidate’s non-federal experience, all multiplied by negative one.
VPStateMargin: Last but not least is the VPStateMargin, weighted by 30.3% of the total base score.The reasons for this are discussed above in VPXP, but it boils down to complementary experience being valued by 1.7 times over opting to pick a vice presidential candidate from a competitive state. If a VP candidate’s state margin, accounting for the generic ballot, is between -7.5 and 7.5, then the VPStateMargin is the square root of the vice presidential candidate’s state’s number of electoral votes over one plus the absolute value of their state margin. This is multiplied by the most competitive average electoral vote adjuster, which was determined by taking the median number of electoral votes per state, which is 8, over a perfectly competitive state (assuming a state margin of 0), which is a value of 1. The square root of 8 is a little over 2.8, which must be multiplied by 10.71 to equal the weight for this factor of 30.3. So 10.71 is the multiplier. This score gets higher if the state they are from has a large electoral vote count and has a very narrow margin. Yes, this technically does let it exceed the total weight in cases where a state with a lot of electoral votes is going to be extraordinarily close, and indeed, if California (with 54 electoral votes) had no partisan lean, picking a vice presidential candidate from California would be a very smart thing to do, so this can overweight this factor if there is a clear electoral advantage to selecting a massive swing state.
If the VPStateMargin is not between -7.5 and 7.5, then the state is not considered competitive for the sake of this value, and it is simply calculated as the VP state’s electoral votes over one plus the absolute value of the state margin.
If you add these four factors together, you’ll have the base score. Multiply the coefficient by the base score to get the VP Score for a given nominee and VP nominee combination. If you choose a nominee it will run this function for every possible VP nominee:
We hope you enjoy the ensuing and abrupt veepstakes as much as we do, and please reach out to us with any questions or thoughts about this ongoing project and our research in this area. And if you are Kamala Harris or have a line to her, please pass our work along! We’re thinking that Democrats, who obviously must have used our tool in 2020, will do so again!