The Postrider’s 2020 Senate Ratings
The presidential election may be hoarding the spotlight this cycle, but Americans across 34 states will simultaneously determine the fate of the nation’s highest deliberative body, the Senate. With 35 seats up for election,Georgia is holding two elections, one for its regular class 2 Senate seat, and the other is a special election for former Senator Johnny Isakson’s seat. He resigned in 2019 and Kelly Loeffler has been serving in his stead. and nearly two-thirds of them controlled by Republicans, the fight for the Senate will be fierce as Democrats seek control of the chamber.
Democrats need to net four — or three, if they also win the White House, as the vice president breaks ties in the Senate — seats to win control of the Senate. They’ve been able to put enough seats in play, considering their intrinsic Senate disadvantage, thanks to strong electoral support at the top of the ticket, and a long tail of races that they have weaker chances to win in more conservative states.
If you followed our 2018 Senate race ratings and analysis last cycle, or our 2020 presidential ratings we released a few weeks ago, you may be familiar with what we’re doing again this year. But here are some things to keep in mind as you look at our Senate map:
Ratings- and Individual-Focused
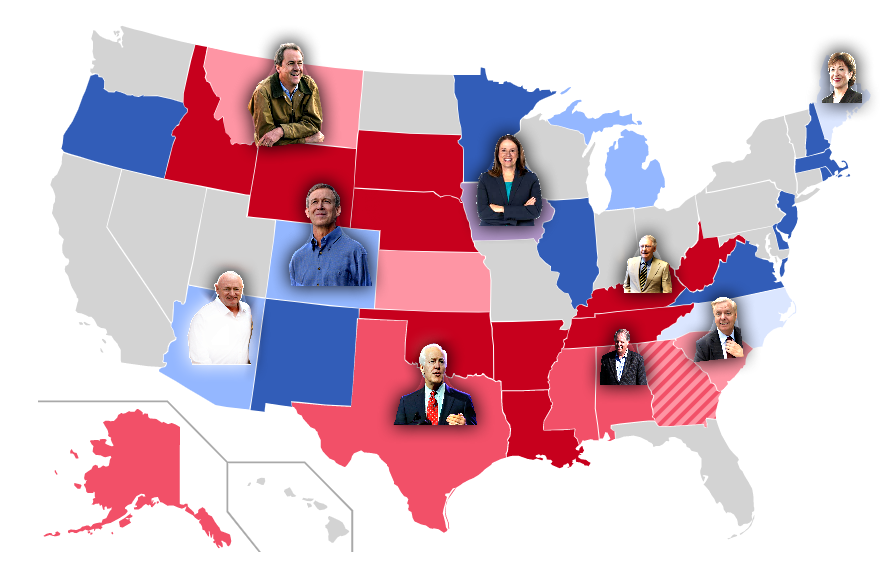
In our 2018 Senate ratings, we focused on telling the individual stories behind the candidates — because candidates matter more in localized races, and less so on the presidential level — and every state’s Senate race is different, with different personalities and dynamics. We’re doing the same thing this cycle, aiming to capture the local quirks, personalities, and stories that make each individual Senate election unique. So, unlike our presidential ratings, which is an analysis of two candidates nationwide and is thus by definition, more nationalized and consistent, we’ll be separating the races out on our Senate map with an intent to focus on what you should know about each individual election.
Each race will be rated on a scale as follows:
| The party has over a 99% likelihood of winning the state. This is an all but assured state for that party, but be mindful that if you were to run the election hundreds of times, thus with hundreds of “Safe” states, you’d expect less than one out of 100 to flip; that’s very low and very rare, but it does happen. Nonetheless, “Safe” means we are confident in a party’s odds in a given safe state. | |
| The party has at least an 85% certainty of winning the state, so the other party has at least an outside chance of winning the state in 1% to 15% of cases. In our map, we have around ten “Likely” states, so if one of them flips, that would not be surprising. It would also not be totally crazy if none of them flip, though the more there are, the more you should expect one to flip. | |
| The party is slightly favored but is by no means safe; the other party has somewhere between a 15% and 40% chance of winning the state too. In our map, we have around five of these states, so it should actually be surprising if at least one of these states does not flip. | |
| The race in this state does not clearly favor either party over the other. Each party has between a 40% and 60% chance of winning the state. |
We determine ratings at large based on polling data, demographic data, news events, historical trends, the electoral environment in similar states,Some states are highly correlated, like the midwestern states of Michigan, Pennsylvania, Wisconsin, Ohio, and Minnesota. If things take a dramatic turn in Wisconsin, you’d expect similar movements across these states based on their similar demographics, political histories, urbanization, population size, economic similarities, etc. Note that geography is not always the best determinator for these variables; for instance, Washington state and Colorado are also similar; as are Maine and Montana. how states are responding to COVID-19 and planning their election procedures, and all sorts of other smaller variables. We then dive into the local conditions, biographies, and narratives in each state’s race to fine-tune our analysis. It’s slightly more scientific than a “gut instinct” but less so than an explicit statistical model. We’re aiming for something closer to the Cook Political Report, Sabato’s Crystal Ball, or Inside Elections,Inside Elections’ publisher is also employed by this author’s employer and The Postrider is completely independent. I mention this for full disclosure. Washington is a small town. with the intent to handicap the race, more so than our idols at FiveThirtyEight, though our various ratings are generally similar other than at the margins. All of our ratings are approved and determined by both the Editor-in-Chief, Michael Lovito, and yours truly, the State & Science Editor.
Update-Oriented
If we decide a state rating merits adjustment, we will publish that under the hover-over for a given state, and write a larger article if necessary. For example, at the time of publication, we have the Colorado race rated as “Likely Democrat”, but if a few weeks from now the Republican candidate has improved his numbers dramatically in traditionally Democratic-voting strongholds around Denver, we’d be inclined to revise our rating in Colorado down to “Lean Democrat”. We will provide a ratings’ history when you click on any given state which will include the date of the ratings revision(s) and an explanatory note or link to a larger piece justifying the change. This will make interacting with our ratings map a little more interesting, involved, and useful to watch as the race goes on and provide more context where necessary.
All ratings revisions will be approved by both of the editors on this project, and based on the same criterion noted above in terms of changes in polling, how the party’s candidates in each state are doing amongst certain demographics, state-by-state correlations, any relevant turns that may occur in these races, etc. We won’t change ratings if we believe they are likely to change by Election Day, since that would defeat the purpose of forward-rating these races, but we will change as often as we need to if compelling evidence points to better or worse prospects for the candidates in a given state.
The Overall Projection
Our projection of the final control of the Senate is not a prediction, it is a mathematical allocation based on the parties’ respective odds across the states. For example, we have Tennessee as “Safe Republican” so we count that as 0.99 seats for Republicans (as “Safe” we’ve determined means it’s at least better than 99/100 odds that the Republican wins that race), or 0.01 seats for Democrats. Meanwhile we’ve rated Arizona as “Likely Democrat”, so we would count that as 0.85 seats for Democrats and 0.15 for Republicans. “Lean” is multiplied by 0.6 and “Toss-Up” by 0.5. Once all states’ Senate races have been split in this way, we round down to the nearest full seat.
At the time of publication, our projection has Democrats at 16 seats as “Lean” or safer, exactly how many they need to win to get control outright without winning the presidency, about on par with FiveThirtyEight’s forecast and a bit more conservative than The Economist’s forecast model. Angus King and Bernie Sanders are both independents who caucus with the Democrats, so we have included them as “Democrats” for the sake of the total count for Senate control, though neither of them are up for election this cycle.
Remember that we’re not making predictions, we’re just providing an educated assessment on the state of the race in every state. So don’t write us a mean note after Election Day saying “you had it as leaning Democrat in North Carolina but then the Republican won by one percent, you goofballs!” No, we didn’t predict that North Carolina will “only” go for Democrats by a little, we’re merely stating it’s more likely than not to go for the Democrat, but the Republican still absolutely has a shot there.
With all of this in mind, The Postrider is proud to present its own ratings and analysis on this year’s Senate elections.